Objective: This exercise demonstrates how to display visualization data in a crosstab format, how to swap axes so that data can be viewed from a different perspective, and how to resize a view
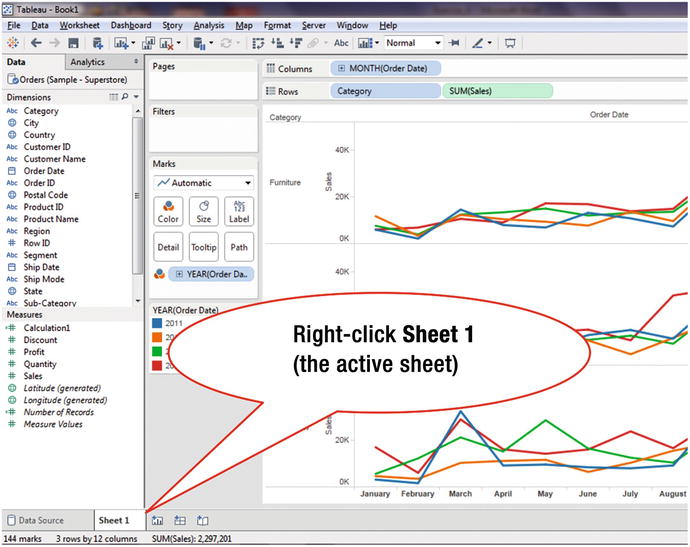
We start this exercise with Figure 11-1, which is based on two dimensions (Category and Order Date) and one measure (Sales).


