Objective: This exercise demonstrates the sort function in more detail
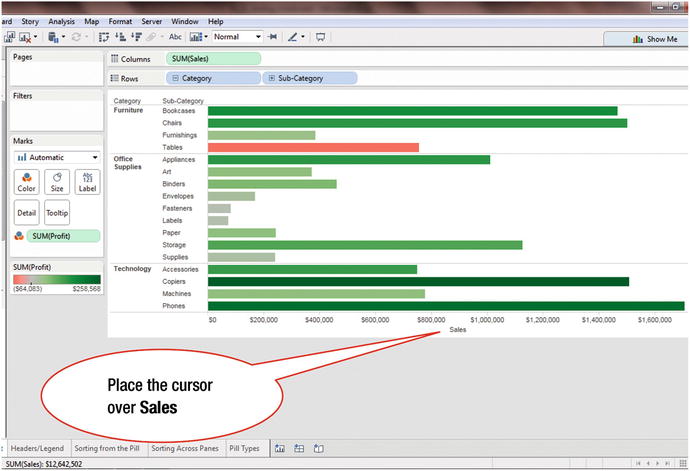
Figure 13-1 shows a chart that displays the sum of Sales by Category and Sub-Category.

Figure 13-1. Visualization to be sorted
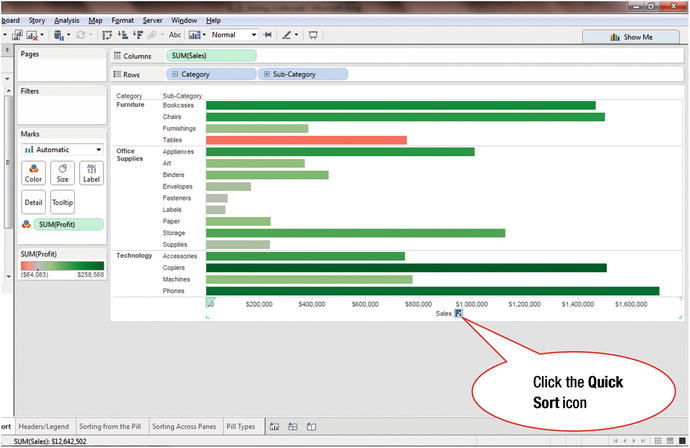
To sort the displayed data using the Quick Sort icon:


