Objective: This exercise demonstrates how a Quick Filter is created, used, and removed
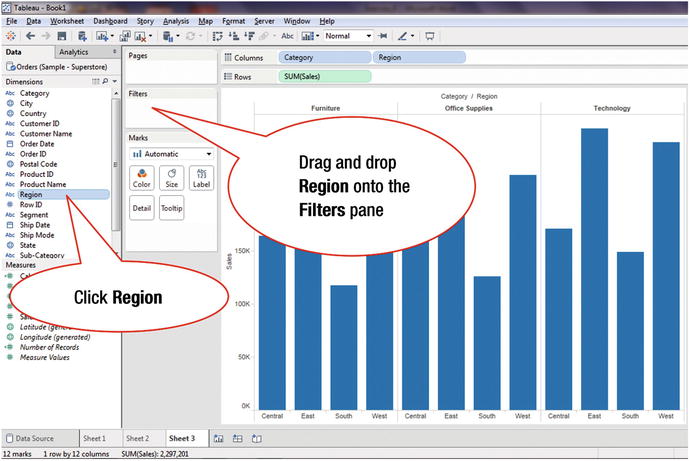
Figure 20-1 displays a view based on Category, Region, and Sales.

Figure 20-1. Visualization without any filter
Quick Filters enable users to focus on smaller datasets so that they can perform analysis from different perspectives. The following steps show how a Quick Filter is added.

