Objective: This exercise demonstrates how to change the display from one chart type to another
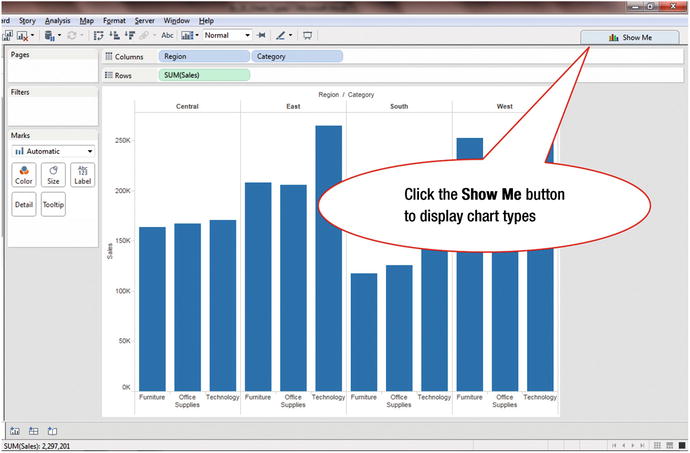
Figure 9-1 shows a bar chart for the sum of Sales by Region and Category.

Figure 9-1. Opening the Show Me window
Figure 9-1 shows the Show Me button, which is used to suggest the appropriate chart based on the selected data or to change the type of chart that is displayed. While Show Me displays many chart types, it only highlights the ones that can be used with the underlying data. ...

