Appendix 3. Full set of ratio charts from sample companies
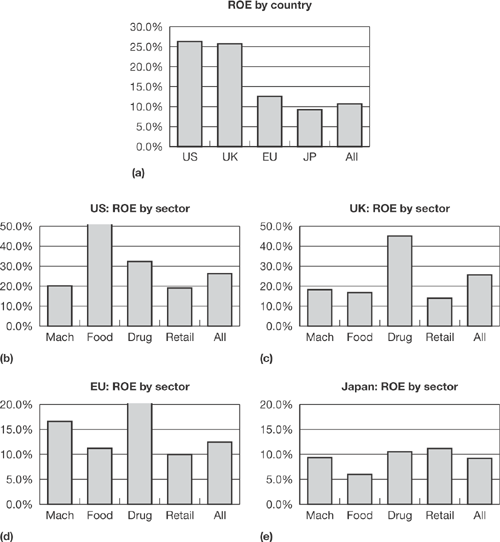
Figure A3.1. Return on equity (%)
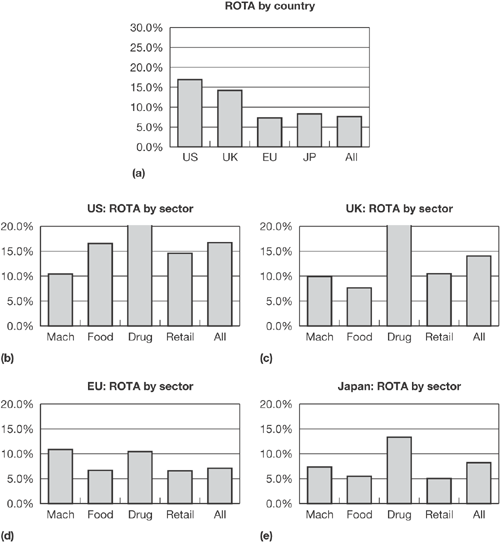
Figure A3.2. Return on total assets (%)
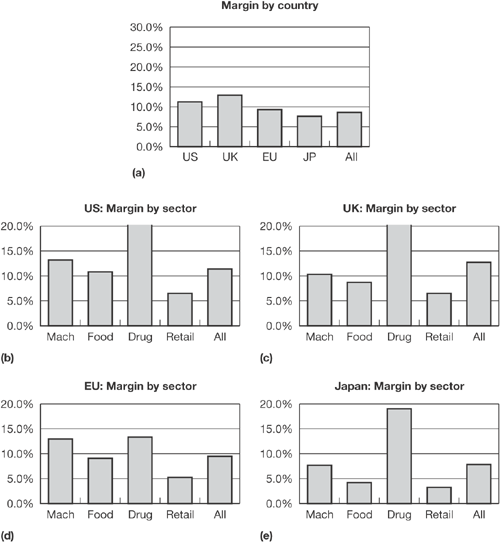
Figure A3.3. Margin on sales (%)
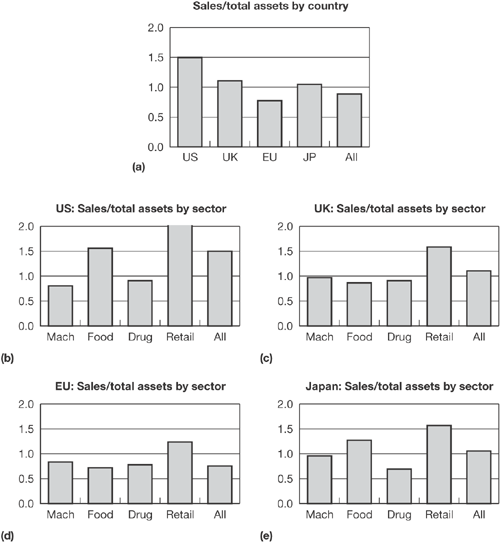
Figure A3.4. Sales to total assets (times)
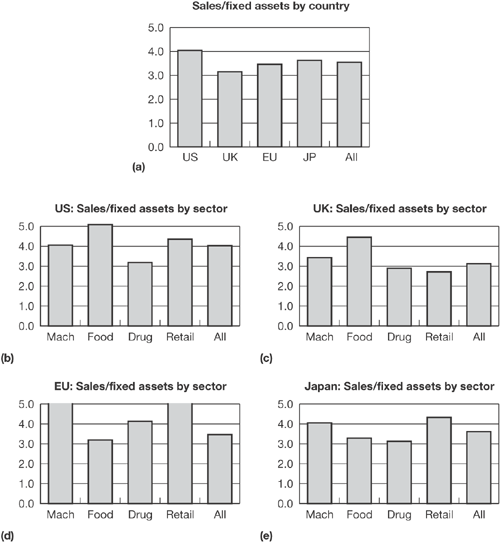
Figure A3.5. Sales to fixed assets (times)
Figure A3.6. Inventory ...
Get Key Management Ratios: The Clearest Guide to the Critical Numbers That Drive Your Business, Fourth Edition now with the O’Reilly learning platform.
O’Reilly members experience books, live events, courses curated by job role, and more from O’Reilly and nearly 200 top publishers.

