Understanding the box plot chart
A box plot is a technical chart that shows data samples in terms of the shape of distribution. Before we can create a box plot chart, we need to understand the basic structure and concept. The following diagram illustrates the structure of a box plot:
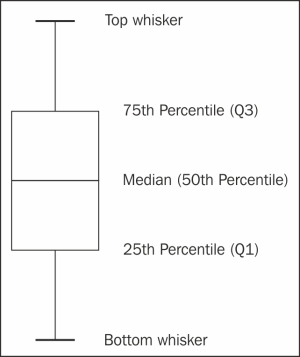
In order to find out the percentile values, the entire data sample needs to be sorted first. Basically, a box plot is composed of top and bottom whisker values, first (Q1) and third (Q3) quartile values, and the median. The quartile Q1 represents the median value between the 50th percentile and the minimum data. Quartile Q3 works in a similar fashion but with maximum ...
Get Learning Highcharts 4 now with the O’Reilly learning platform.
O’Reilly members experience books, live events, courses curated by job role, and more from O’Reilly and nearly 200 top publishers.

