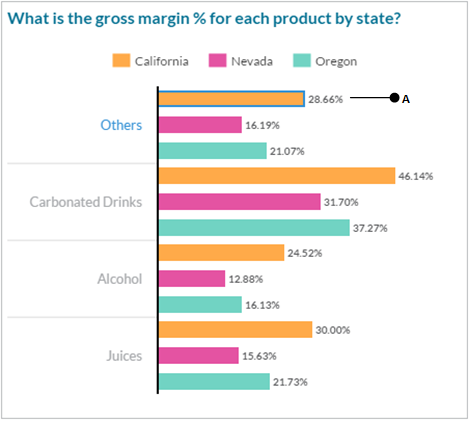
The initial view of this chart provides a high-level overview of the gross margin percentage for each product category by state:

For example, if you mouse over the bar representing California in the Others product category (A), the tooltip (B) shows that the gross margin percentage is 28.66% for this category in California. For Nevada, it is 16.19%, and for Oregon, it is 21.07%:

Click on the Others link(C). A small toolbar will appear. Click on the drill-down link (D) in the toolbar. You will drill into details ...

