JavaScript debugger
The JavaScript debugger is sort of a re-launch of a ServiceNow feature that was removed in the Fuji release. Since then, the feature has undergone a major overhaul before being reintroduced, resulting in the functionality that we now have access to in Istanbul and later versions of the Now platform.
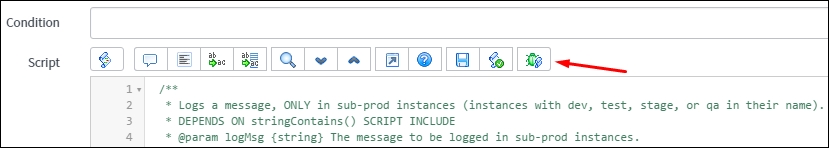
The debugger can be opened by clicking on the JavaScript debugger button in the list of icons above any Script field, such as those above the Script field on a business rule.
Nearly everything relating to debugging happens within a specific session, and the JavaScript debugger is no different. In order for the debugger to interact with ...
Get Learning ServiceNow now with the O’Reilly learning platform.
O’Reilly members experience books, live events, courses curated by job role, and more from O’Reilly and nearly 200 top publishers.

