March 2020
Beginner
380 pages
9h 44m
English
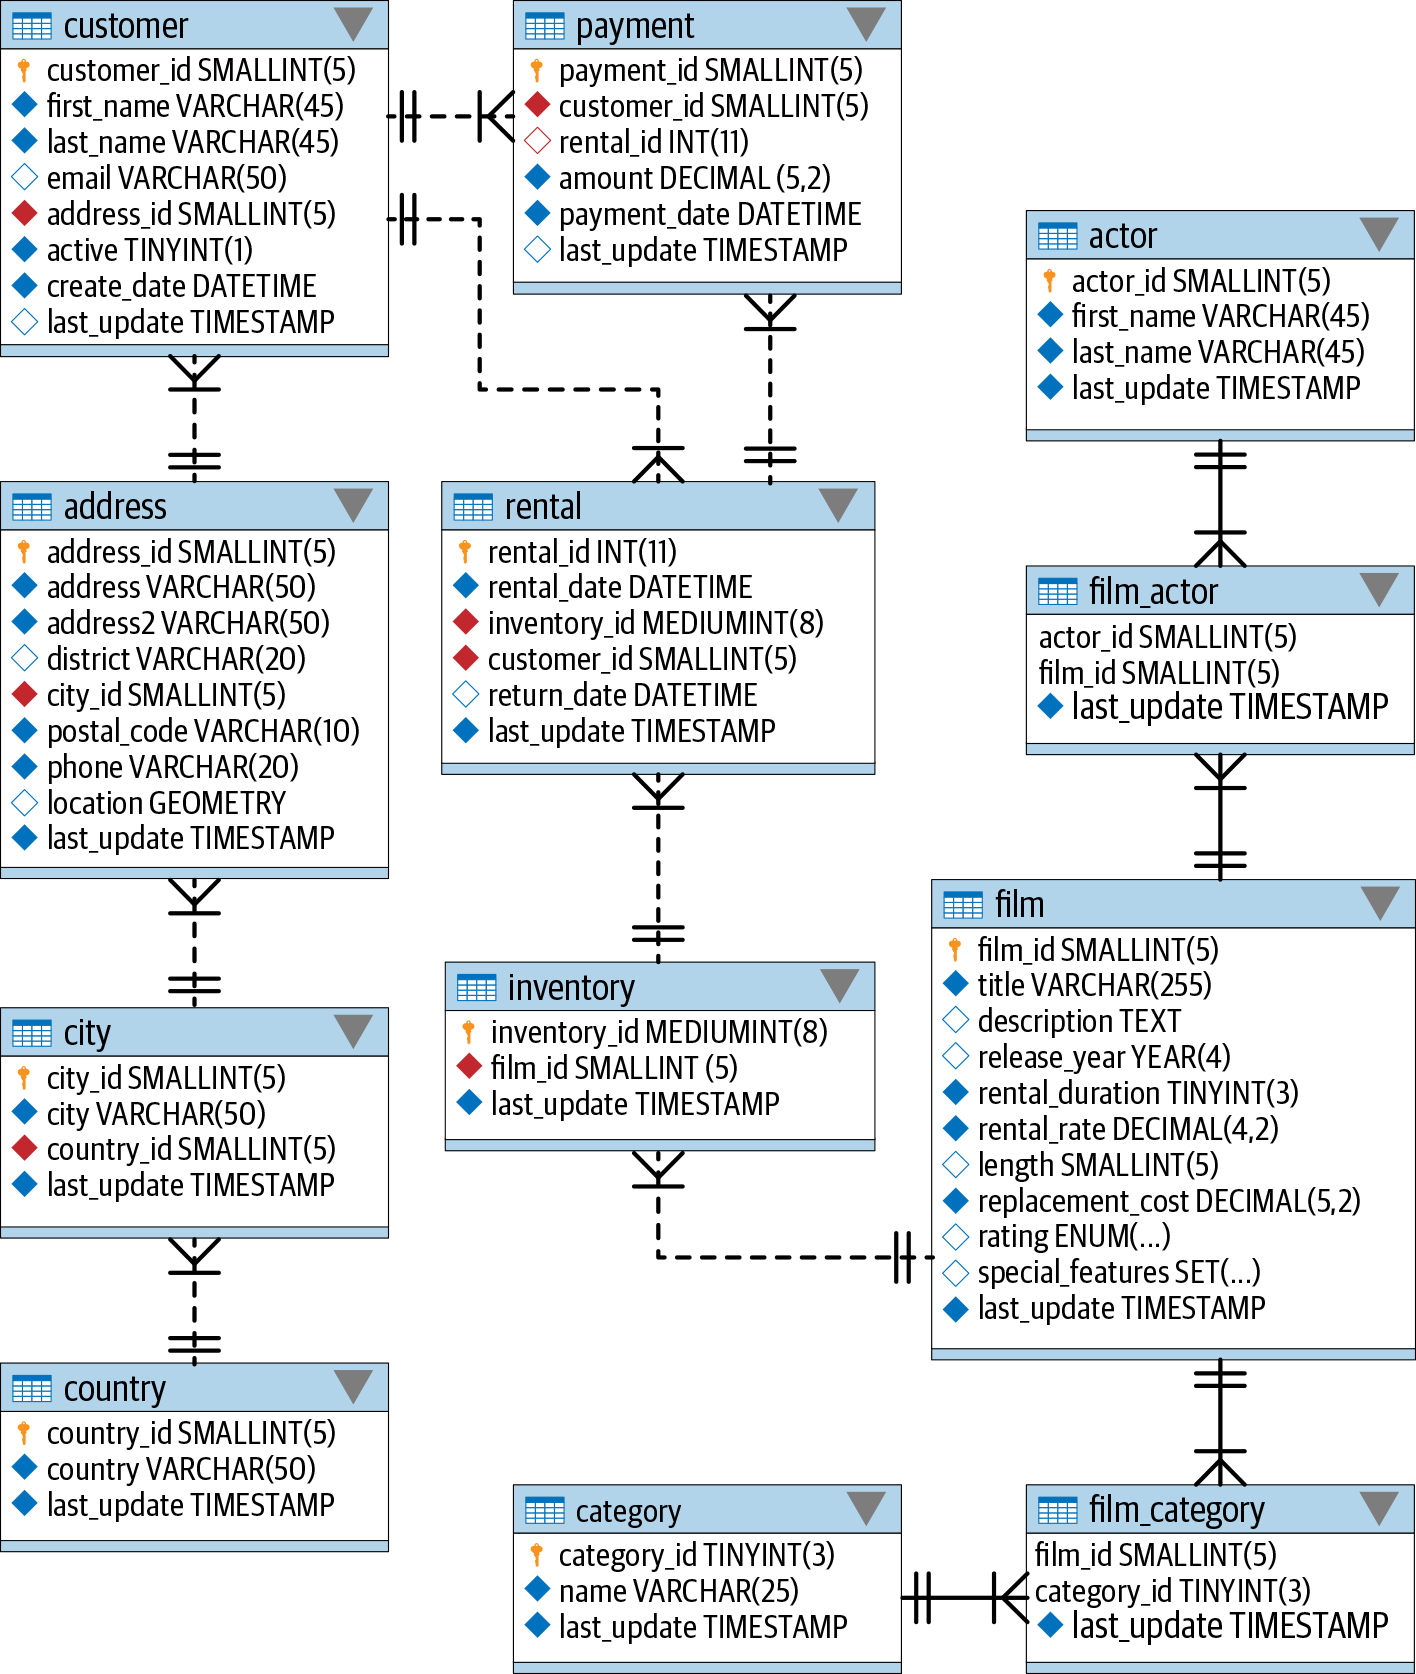
Figure A-1 is an entity-relationship (ER) diagram for the example database used in this book. As the name suggests, the diagram depicts the entities, or tables, in the database along with the foreign-key relationships between the tables. Here are a few tips to help you understand the notation:
Each rectangle represents a table, with the table name above the upper-left corner of the rectangle. The primary-key column(s) are listed first, followed by nonkey columns.
Lines between tables represent foreign key relationships. The markings at either end of the lines represent the allowable quantity, which can be zero (0), one (1), or many (<). For example, if you look at the relationship between the customer and rental tables, you would say that a rental is associated with exactly one customer, but a customer may have zero, one, or many rentals.
For more information on entity-relationship modeling, please see the Wikipedia entry on this topic.