March 2019
Beginner
504 pages
11h 17m
English
Another possibility for showing distributions is to use a histogram. A histogram looks similar to a bar chart, but the bars show a count of occurrences of a value. For example, standardized test auditors looking for evidence of grade tampering might construct a histogram of student test scores. Typically, a distribution might look like this:
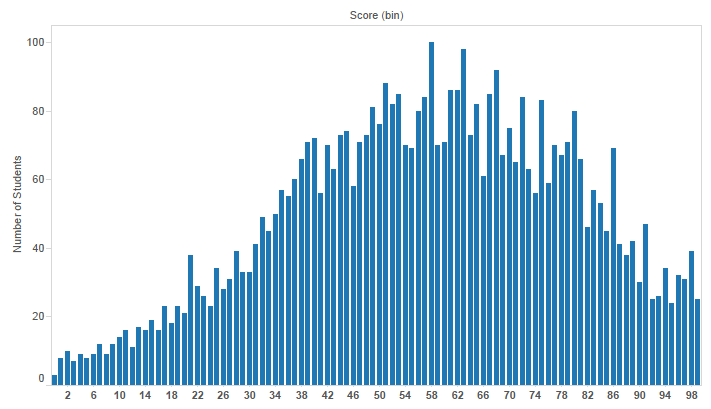
The test scores are shown on the x axis and the height of each bar shows the number of students that made that particular score. A typical distribution should have a fairly recognizable bell curve, with some students doing poorly, some doing extremely well, and most falling toward somewhere ...
Read now
Unlock full access


