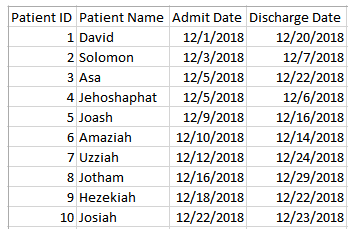
Let's say you have a table in a server database (such as SQL Server or Oracle) that contains one row per hospital patient and includes the Admit Date and Discharge Date as separate columns for each patient:

While this data structure works well for certain kinds of analysis, you would find it difficult to use if you want to visualize the number of patients in the hospital day-by-day for the month of December.
For one, which date field do you use for the axis? Even if you pivoted the table so that you had all of the dates in one field, you would find that you have gaps in the data. Sparse ...

