March 2019
Beginner
504 pages
11h 17m
English
Using the preceding bar chart, you can easily see that the technology department has more total sales than either the furniture or office supplies departments. What if you want to further understand sales amounts for departments across various regions? Follow these two steps:
You should now have a view that looks like this:
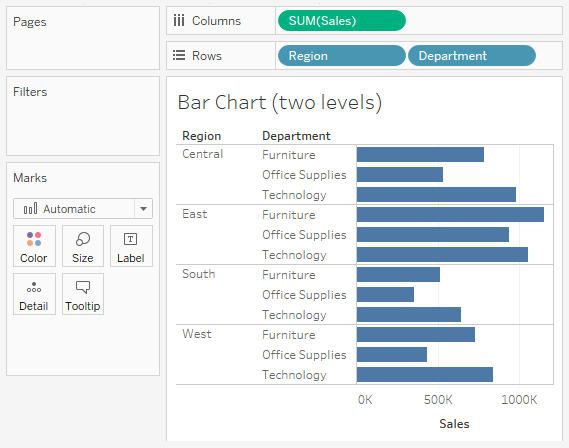
You still have ...
Read now
Unlock full access


