4
Telecommunications Economies of Scale
4.1 Market Size and Projections
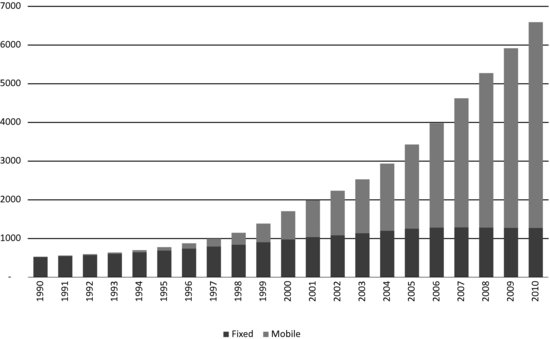
The starting point of this chapter is the remarkable rise of mobile connectivity relative to fixed connectivity as a percentage of the world market expressed in terms of global connections.
Figure 4.1 is sourced from our colleagues at The Mobile World, as are all the market and business statistics used in this book, and shows a crossover point in 2002 when mobile matched fixed for the first time and then a year-on-year transition to where we are today with an almost five-to-one relationship.
Figure 4.1 Global connections, 1990 to 2010. Reproduced with permission of The Mobile World.
This of course has had a profound and largely positive impact on the part of the industry supply chain that services the mobile market, though we argued in our introduction that overspending on spectral investment has constrained R and D spending in some critical areas including some areas of RF component innovation that in turn has made it more difficult to get a return from that investment.
Table 4.1 provides a simplified overview of this supply chain.
Table 4.1 Industry supply chain
The arrows denote risk and value distribution that can either be horizontal or vertical. Risk is a poison chalice that tends to get moved around. ...

