Chapter 18
Diversification: When More Is Less
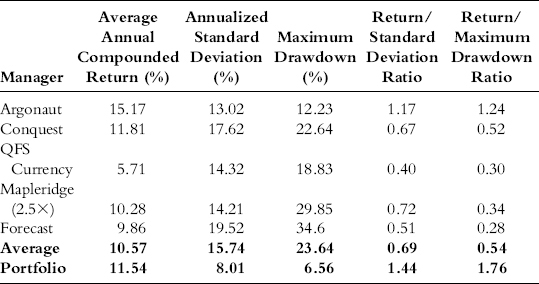
Fred, a research analyst at a fund of funds firm, is given the task of constructing a portfolio of futures, global macro, and foreign exchange (FX) managers. After some research, he reports back to his boss, Sam, with a suggested five-manager portfolio shown in Table 18.1. The five managers have an average annualized return of 10.57 percent and an average annualized standard deviation of 15.74 percent. The average maximum drawdown of the five managers is 23.64 percent. Because of the benefits of diversification, the portfolio statistics are far better: an annualized return of 11.54 percent with a standard deviation of only 8.01 percent and a much reduced maximum drawdown of 6.56 percent.
Table 18.1 Five-Manager Portfolio Statistics, January 2001 to June 2010
Sam reviews the suggested portfolio and then calls Fred into his office. “The managers you picked appear to be an interesting mix,” he says, “but I am troubled that there are only five managers in the portfolio. We need to have much more diversification. I would like to add these 10 managers I have been looking at.” He hands Fred the list of managers in Table 18.2.
Table 18.2 Ten Added Manager Statistics, January 2001 to June 2010
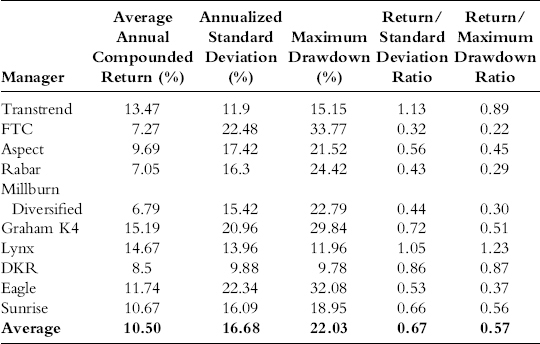
Sam continues, “Interestingly, the average return ...
Get Market Sense and Nonsense: How the Markets Really Work (and How They Don't) now with the O’Reilly learning platform.
O’Reilly members experience books, live events, courses curated by job role, and more from O’Reilly and nearly 200 top publishers.

