Chapter 4. Real-Time Processing in Azure
Real-time processing is defined as the processing of a typically infinite stream of input data, whose time until results ready is short—measured in milliseconds or seconds in the longest of cases. In this first chapter on real-time processing, we will examine various methods for quickly processing input data ingested from queueing services like Event Hubs and IoT Hub (Figure 4-1).
Stream Processing
When it comes to stream processing, there are generally two approaches to working through the infinite stream of input data (or tuples): you can process one tuple at a time with downstream processing applications, or you can create small batches (consisting of a few hundred or a few thousand tuples) and process these micro-batches with your downstream applications. In this chapter we will focus on the tuple-at-a-time approach, and in the next we will examine the micro-batch approach.
For our purposes in this book, the source of streamed data processed by an analytics pipeline is either Event Hubs or IoT Hub. The options consolidate further when you consider that when it comes to the services side of IoT Hub (i.e., the side that consumes and processes ingested telemetry), it is exposing an Event Hubs–compatible endpoint. In other words, regardless of whether we ingest via Event Hubs or IoT Hub, we process the messages by pulling from Event Hubs (see Figure 4-2).
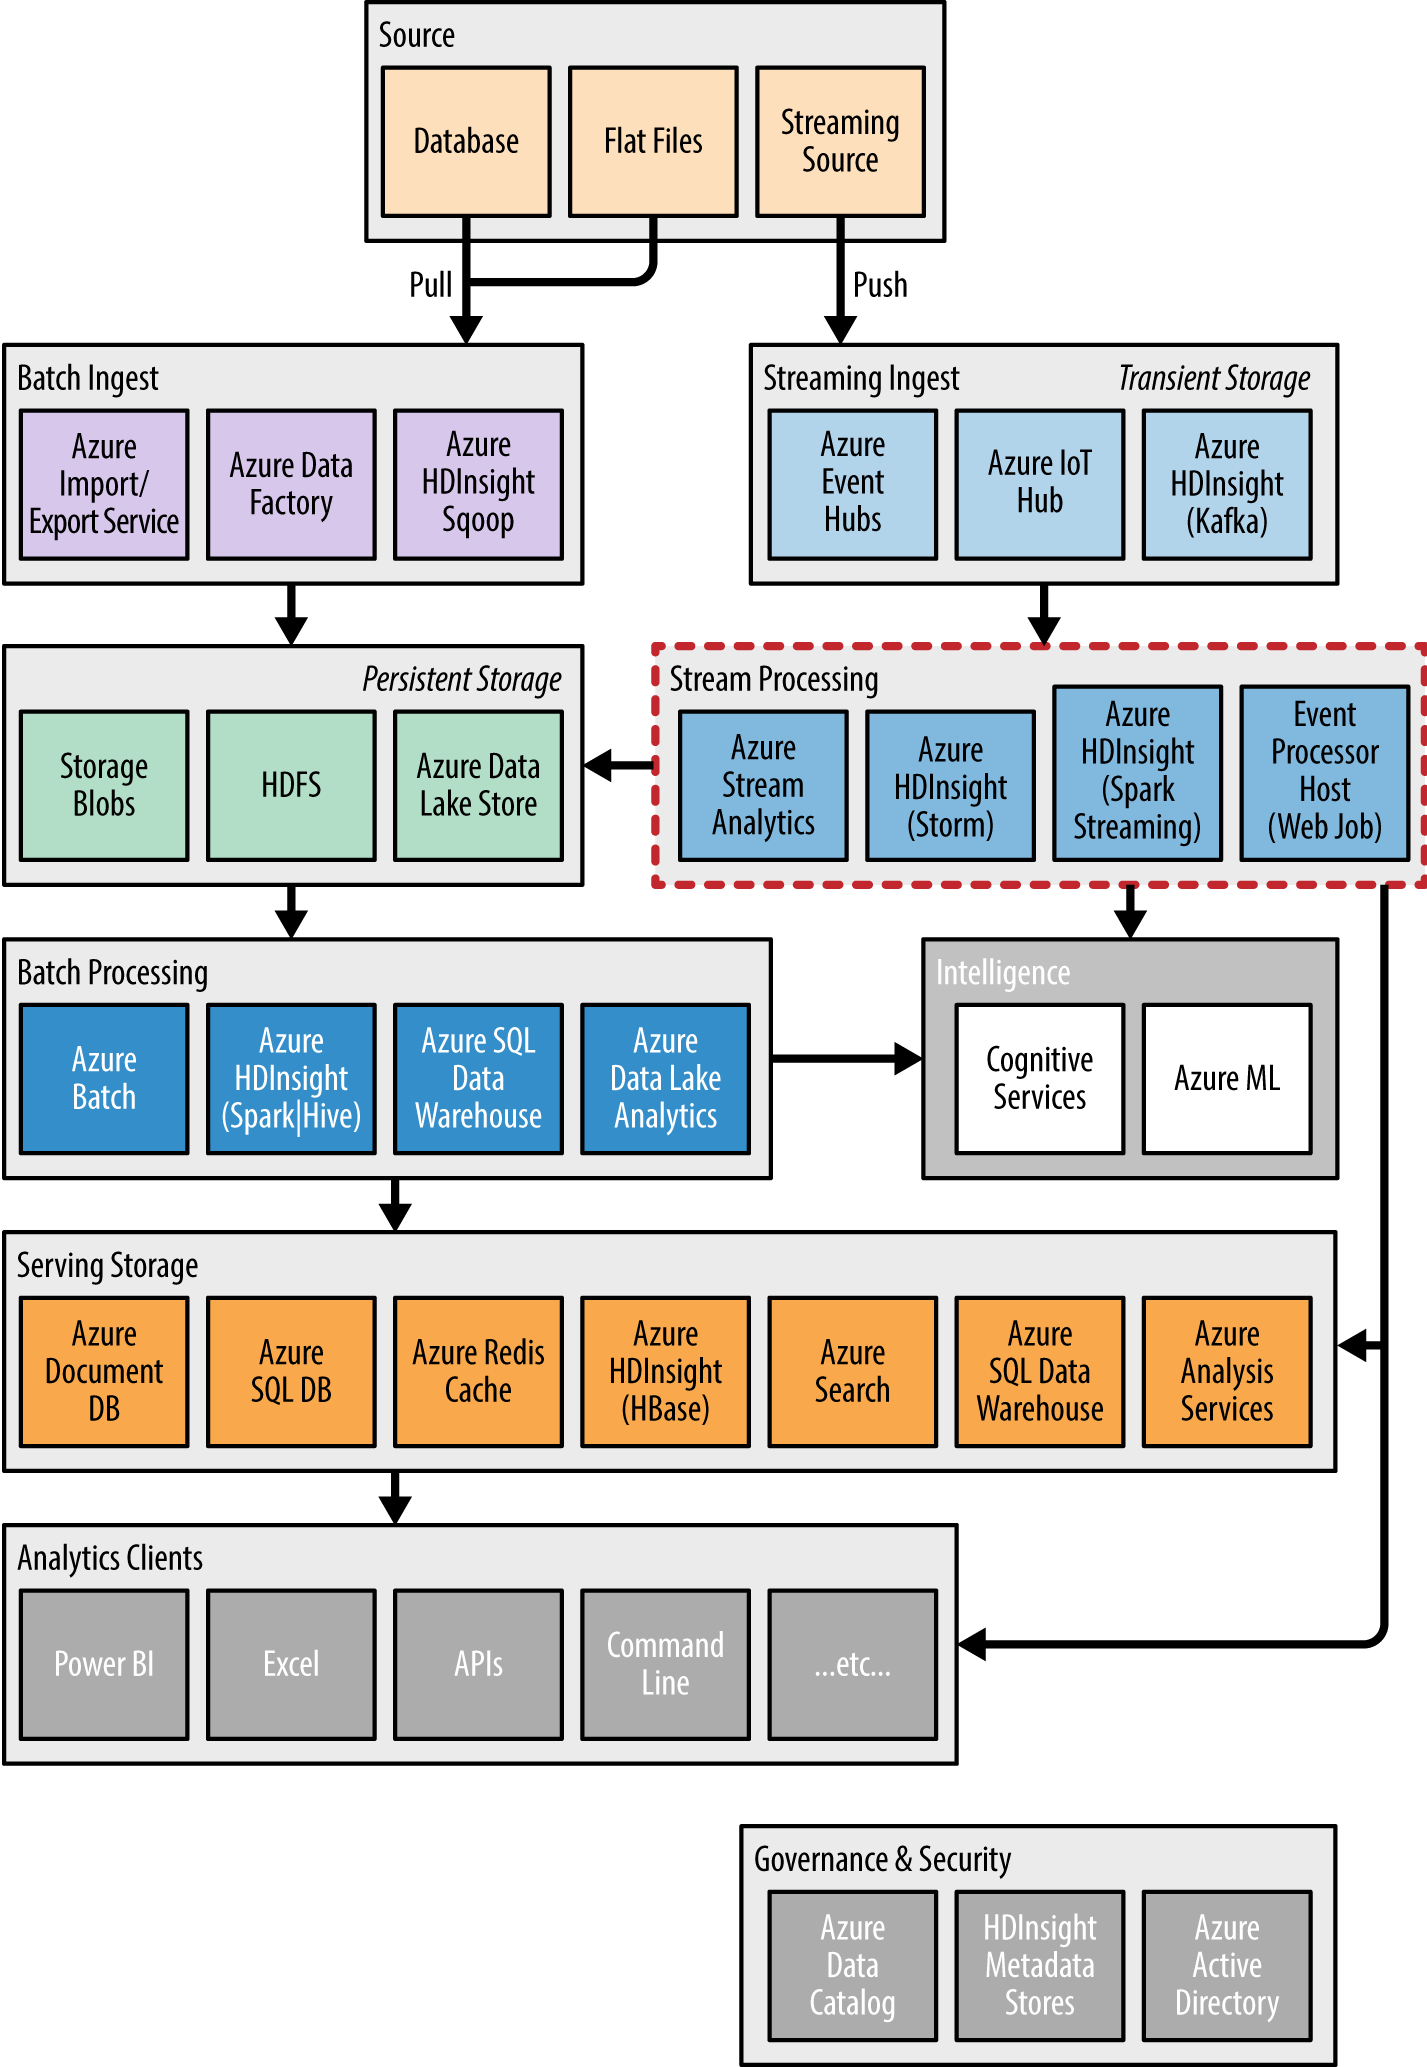
Figure 4-1. This chapter focuses on a subset of the listed stream processing components that process data in a tuple-at-a-time fashion.

Figure 4-2. High-level view of the ingest and consumptions side of Event Hubs.
Consuming Messages from Event Hubs
We covered how Event Hubs ingest data from clients into Event Hub partitions in depth in the previous chapter.In this chapter we focus on the path that pulls event data from Event Hub partitions: the event consumer applications. There are SDKs to build consumers in .NET, Java, and Node.js. However, be aware that not all SDKs provide support for both sending to and receiving from Event Hubs. An example of this is the Azure Event Hub client for C, which is intended for embedded devices to utilize in transmitting their data to Event Hubs (and not for these devices to consume Event Hub events).
Regardless of the implementation used for the consumer, there are some cross-cutting concepts that apply. We will address those here and demonstrate the SDK specifics in sample implementations.
The consumer (also referred to as the receiver) of the Event Hub draws events from a single partition within an Event Hub. Therefore, an Event Hub with four partitions will have four consumers—one assigned to consume from each partition. The consumers communicate with Event Hubs via the AMQP protocol, and the payload retrieved is an EventData instance (having both event properties and a binary serialized body).
The logical group of consumers that receive messages from each Event Hub partition is called a consumer group. The intention of a consumer group is to represent a single downstream processing application, where that application consists of multiple parallel processes, each consuming and processing messages from a partition. All consumers must belong to a consumer group. The consumer group also acts to limit concurrent access to a given partition by multiple consumers, which is desired for most applications, because two consumers could mean data is being redundantly processed by downstream components and could have unintended consequences.
In the situation where multiple processes need to consume events from a partition, there are two options. First, consider if the parallel processing required should belong in a new consumer group. Event Hubs has a soft limit that allows you to create up to 20 consumer groups. Second, if the parallel processing makes sense within the context of a single consumer group, then note that Event Hubs will allow up to five such processes within the same consumer group to process events concurrently from a single partition.
On the event consumer side, Event Hubs works differently from traditional queues. In the traditional queue, you typically see a pattern called competing consumers. It is so named because each consumer targeting a queue is effectively competing against all other consumers targeting the same queue for the next message: the first consumer to get the message wins, and the other consumers will not get that message (Figure 4-3).
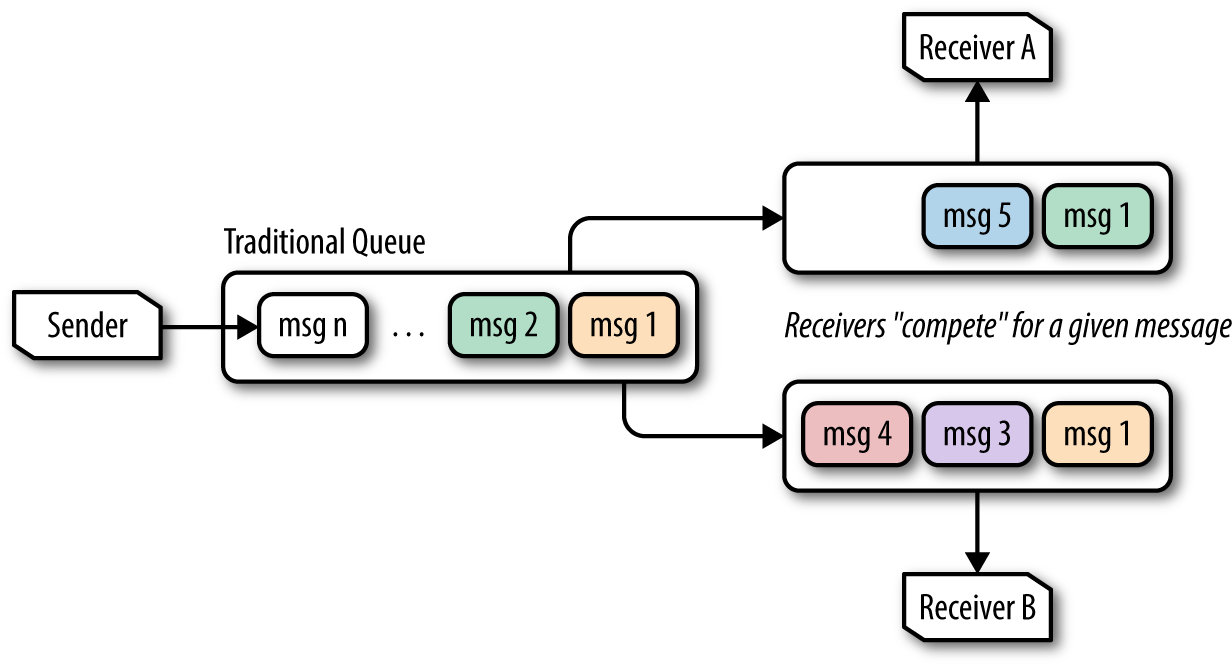
Figure 4-3. Two receivers dequeueing messages in a competing consumer pattern; notice that Receiver A and Receiver B never receive the same message.
By contrast, you can look at Event Hubs (or more precisely, the partitions within an Event Hubs instance) as following a multiconsumer (or broadcast) pattern where every consumer can receive every message (Figure 4-4).
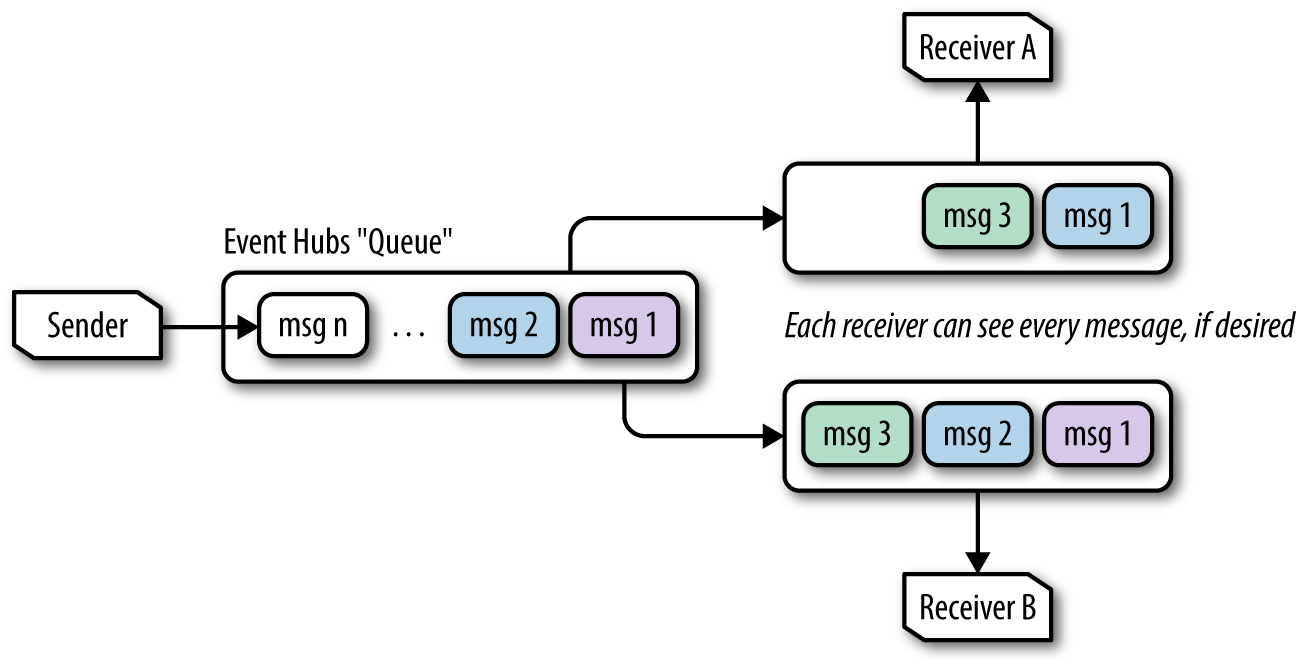
Figure 4-4. Example of two Event Hubs receivers dequeueing messages, where the messages Receiver A gets are not affected by messages acquired by Receiver B.
The critical difference between the two dequeuing patterns amounts to state management. In competing consumers, the queue system itself keeps track of the delivery state of every message. In Event Hubs, no such state is tracked, so managing the state of progress through the queue becomes the responsibility of the individual consumer.
So what is this state that the consumers manage? It boils down to byte offsets and message sequence numbers in a process called checkpointing. If you think of the underlying storage for a partition as a file, then you can think of the byte offset as a way of describing a location in the file. Anything before the byte offset represents messages you have already consumed, and anything after the byte offset represents messages awaiting consumption. Sequence number is similar, except instead of measuring an offset in bytes, it is an ordinal based on the message position (so you might have a sequence number of 10, indicating you had consumed 10 messages and your next message will be the 11th). Both the byte offset and sequence number increase as messages are added to the partition.
Consumers checkpoint their sequence number and an offset to some form of durable storage, such as Azure Blob Storage or Apache Zookeeper, which enables new consumer instances to be started and resume from the checkpoint location should the consumer process fail.
An important side effect of outsourcing this state management to the consumer is that messages are no longer deleted from the queue when processed (as in the competing consumers pattern). Instead, Event Hubs queues have a retention period of 1 to 7 days, and it is the expiration of that retention period that effectively ages out and deletes messages. With that retention period in mind, each partition tracks a begin sequence number and an end sequence number that represents the current range of available events. You can observe these values using the SDKs or with tools like Service Bus Explorer, pictured in Figure 4-5.

Figure 4-5. Service Bus Explorer showing the begin and end sequence numbers for a partition in Event Hubs.
When consumers process events from a partition, they can typically choose to indicate either a byte offset or a start date/time. They can begin consuming messages anywhere in the stream of events within the retention period.
Consumer groups manage one final value, which has to do with the versioning of the consumer application: the epoch. For a given partition, the epoch represents the numeric “version” or “phase” of the consumer and can be used to ensure that only the latest is allowed to pull events. When a higher-valued epoch receiver is launched, the lower-valued one is disconnected.
It is possible to create a receiver without an epoch, in which case the epochs are not enforced, but it is here that you are limited to five concurrent consumers per partition/consumer group combination. The epoch value is typically supplied when the consumer is created (at the same time where it might indicate an offset).
Table 4-1 summarizes the egress limits applicable to Event Hubs consumers.
| Item | Limits |
|---|---|
| Consumer groups | Max of 20 consumer groups per Event Hub |
| Consumers per partition | Max of 1 consumer per partition per consumer group when consumer created with epoch; up to 5 consumers per partition per consumer group when consumer created without epoch |
| Egress throughput | 2 MB/s per TU; no limit on # of events per second |
We will show many examples of clients that consume messages from Event Hubs using the preceding concepts. That said, many of the SDKs abstract away some of these details and make the consumer application easier to implement. It’s important to recognize that these concepts are still taking effect “under the covers.”
Tuple-at-a-Time Processing in Azure
This chapter focuses on tuple-at-a-time processing options including Storm on HDInsight (in Java and .NET) and the Event Processor Host API for use in .NET.
Introducing HDInsight
HDInsight provides Hadoop ecosystem components in the form of a managed service. It takes the burden off of you from having to create, configure, and deploy individual virtual machines in order to build a cluster, keep it operational, and scale it by adding or removing nodes. HDInsight uses the Hortonworks Data Platform (HDP) to provide a consistent set of Hadoop ecosystem components, where the versions of each have been tested to work well together. HDInsight lets you provision clusters for major components such as Apache Spark, Apache Storm, Apache HBase, Apache Hive, Apache Pig, and, of course, Apache Hadoop.
HDInsight Hadoop Components
For a complete listing of all the Hadoop ecosystem components available and their versions in each release of HDInsight, see the Microsoft Azure documentation.
Storm on HDInsight
HDInsight enables you to easily provision clusters that run Apache Storm, and tooling from Microsoft makes it easy to manage Storm using the Azure Portal and Visual Studio.
Apache Storm provides a scalable, fault-tolerant platform for implementing real-time data processing applications. From a physical view a Storm application runs in perpetuity across a cluster of nodes with separate responsibilities. Zookeeper nodes run Apache Zookeeper and are used to maintain state. Supervisor nodes run worker processes, which in turn spawn threads called executors. These executors provide the compute cycles to run tasks, which are instances of Storm components that contain the processing logic. Nimbus nodes keep tabs on the supervisors and the tasks they are running, restarting them in the face of failures.
From a logical perspective, what you actually implement—a Storm application—is built by defining a topology. A topology describes a directed acyclic graph, meaning looping is not permitted.
Storm takes the approach that input data is viewed as a continuous stream, where each datum in the stream is called a tuple. In this graph, the entry point of the data stream is the spout, and it is responsible for consuming the input data stream, such as reading from a filesystem or a queue, and emitting tuples for downstream processing. Bolts receive a stream of tuples from the spout, process the tuples one at a time, and either emit them for further processing by another layer of bolts or complete the processing (such as by writing the result to a data store).
The way in which a tuple is assigned to a downstream bolt is controlled by stream grouping. For a given downstream bolt, the stream grouping identifies the source and parent component (spout or bolt) by name, and indicates how tuples should be distributed among the instances of the bolt. These stream groupings include:
- Shuffle grouping
-
Randomly distributes tuples among all of the bolt’s tasks.
- None grouping
-
Effectively the same as shuffle grouping.
- Local or shuffle grouping
-
If the target bolt shares a worker process with the source task, then that bolt task is preferred for receiving the tuple. Otherwise, the tuple is randomly distributed to one of the bolt’s tasks (as done by shuffle grouping). The idea is to keep the tuple within the same worker process and avoid an interprocess or network transfer.
- Fields grouping
-
Partitions the stream so that fields of the tuple having the same value are assigned to the same bolt task.
- Partial key grouping
-
Performs the same grouping as fields grouping, but instead of having a single task for any given group, there are always two bolt tasks between which the tuples are distributed.
- All grouping
-
The task is broadcast to all bolt tasks.
- Direct grouping
-
Allows the producer of the tuple to specifically indicate which bolt task will receive the tuple.
- Global grouping
-
This is the opposite of all grouping; it indicates that all upstream tuples should flow to one bolt task.
Out of the box, Storm includes prebuilt spouts for consuming from queueing systems such as Azure Event Hubs, Apache Kafka, and RabbitMQ. It also includes bolts that are capable of writing to filesystems, like HDFS, and interacting with data stores, such as Hive, HBase, Redis, and databases accessible by JDBC.
While a given tuple is flowing through the directed acyclic graph described by the topology, Storm is able to keep track of its progress. It can provide three different processing guarantees:
- No guarantee
-
Not all situations require guarantees that an incoming tuple not be lost or fail to be processed.
- At-least-once guarantee
-
Ensures that any given tuple will never fail to be processed, even if it means it must be processed multiple times because previous attempts encountered a failure.
- Exactly-once guarantee
-
Ensures that any tuple running in the topology is processed to completion by the topology, with mechanisms to ensure resiliency of processing in the face of failure without reprocessing.
In the context of tuple-at-a-time processing in this section, we will focus on topologies that offer at-least-once tuple processing guarantees.
Let’s briefly explore at a high level how Storm provides an at-least-once guarantee. Assume we have tuple input into the topology. Storm keeps track of the success or failure status of this tuple at every step in the topology. It does so by requiring each spout or bolt component that receives the tuple to do two things: it must acknowledge the tuple was processed successfully (or fail it outright), and when the component emits a new tuple in response to this original tuple, it must “anchor” the new tuple to the original. By relating all derived tuples to the original tuple sourced at the spout using this anchoring technique, Storm is able to establish a lineage for tuples processed by a topology. By having this lineage, Storm can compute if a given input tuple was fully processed by all components. It can also detect if a tuple failed to process, by checking at the end of a window of time if it has been successfully processed by all components. If not, the processing can be retried.
Applying Storm to Blue Yonder Airports
To understand how tuple-at-a-time processing works with Storm, let’s apply it to a situation within the Blue Yonder Airports scenario. When it comes to the ambient temperature around a gate, BYA would like to keep the temperatures within a fairly narrow range throughout the course of the day. If the temperature is outside of the range, then either the thermostat is malfunctioning or there is actually a problem at the gate. They would like the system to call attention to it by raising an alert. The overall Storm topology looks like Figure 4-6.
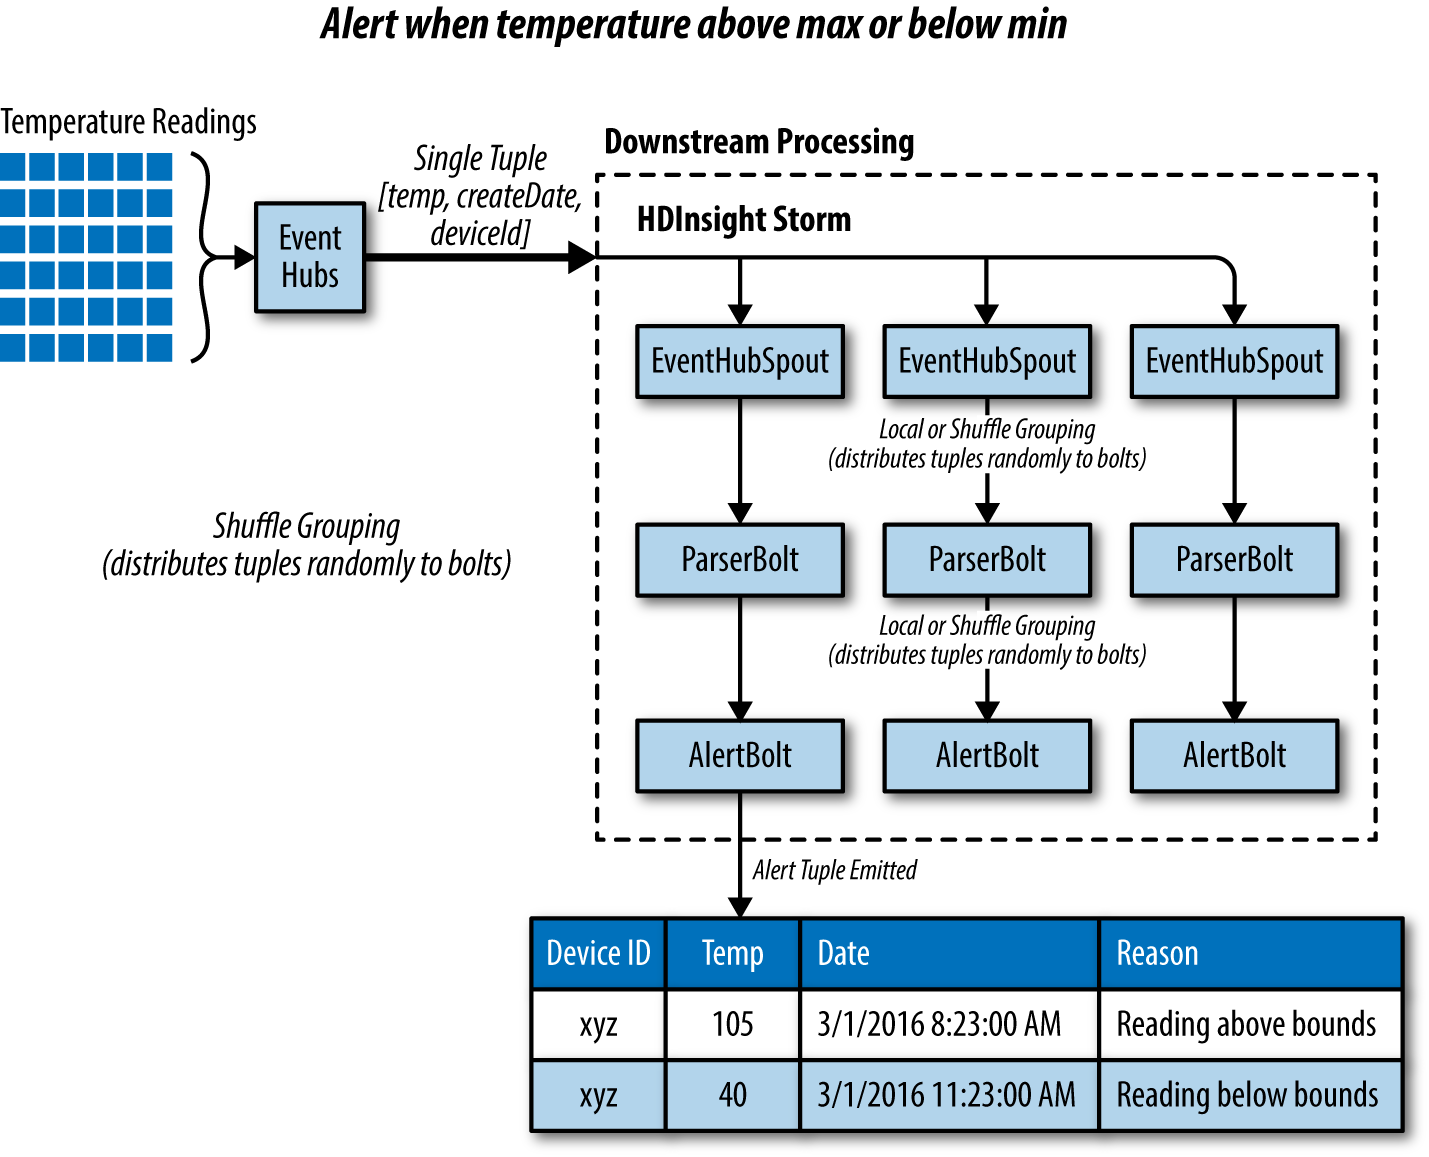
Figure 4-6. Using Storm to process tuples from Event Hubs in a tuple-at-a-time fashion in order to raise alerts about exception conditions.
In the approach, we collect the temperature telemetry into Event Hubs (or IoT Hub) as we have shown previously. HDInsight runs a Storm topology that reads tuples from Event Hubs. There is one instance of an EventHubSpout for each partition present in Event Hubs. The EventHubSpout also checkpoints its progress through the Event Hub partitions, maintaining this state in Zookeeper. This enables the topology to be restarted (such as in the case of supervisor node failure) and the reading of events to be resumed where the EventHubSpout left off. The topology uses the LocalOrShuffleGrouping to randomly distribute the tuples received by the EventHubSpout to a ParserBolt instance, which has the effect of preferring to send the tuple to a ParserBolt instance that is running within the same worker as the EventHubSpout. This eliminates a network transfer between separate worker processes and can dramatically improve topology throughput. If there is no local ParserBolt available, the LocalOrShuffleGrouping sends the tuple to a randomly selected ParserBolt.
The ParserBolt deserializes the telemetry string, and parses the JSON it contains. If the tuple object has a temperature field, then the ParserBolt emits a new tuple (consisting of the three fields: temperature, date created, and device ID) for downstream processing by the AlertBolt. If the telemetry lacks a temperature field, then the logic assumes it is not a temperature reading and no tuple is emitted—effectively ignoring the telemetry input.
The AlertBolt receives the tuple, and checks if the value of the temperature field is greater or less than a configured value. If either is true, then it emits a new tuple that contains the original three fields, plus a new field that provides the reason for emitting this alert tuple. On the other hand, if the tuple is within range, then no tuple is emitted.
The assumption is this alert tuple could then be handled by downstream components, either by storing it in a data store or by invoking an API. We will show examples of consuming this alert later in the book.
Alerting with Storm on HDInsight (Java + Linux Cluster)
Storm topologies can be implemented on HDInsight in two ways: they can be implemented in Java and run on either a Windows or Linux HDInsight cluster, or they can be implemented in C#, which requires a Windows HDInsight cluster.
In this section we will explore the Storm implementation in Java and run it on a Linux HDInsight cluster.
Dev environment setup
While there are many IDEs you can choose from to develop in Java, for the following section we choose IntelliJ IDEA. If you are new to Java development, this allows us to give a simple from-zero-to-sixty option that gets you productive with Storm quickly. If you are established with Java, feel free to modify the following to the IDE of your choice.
For our purposes, you only need IntelliJ IDEA Community Edition, which you can download for the platform (Windows, macOS, and Linux) of your choice from https://www.jetbrains.com/idea/#chooseYourEdition.
Once you’ve downloaded the installer and completed the guided installation with the default settings, you are ready to go. The next step is to download and open the Blue Yonder Airports sample in IntelliJ IDEA.
You can download the Storm sample from http://bit.ly/2beutHQ.
The download includes the Alerts Topology sample, and when opened in IntelliJ IDEA will automatically download all dependencies, including Storm.
Once you have downloaded the sample, open IntelliJ IDEA and follow these steps:
-
Select File→Open.
-
In the “Open File or Project” dialog, navigate to the folder that contains the sample, and select that folder.
-
Click OK.
-
If you are prompted to import dependencies, do so.
You should now be ready to explore the project. In the project tree view, expand source→main→java→net.solliance.storm. You should see the three classes that define the topology, the parser bolt, and the alert bolt, respectively, as shown in Figure 4-7.
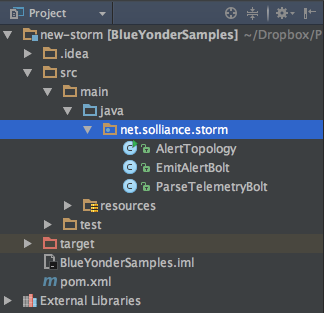
Figure 4-7. The three classes that make up the alerting solution.
Next, expand source→main→resources. This folder contains the config.properties file that holds the settings used to connect to your previously created Event Hubs instance (Figure 4-8).
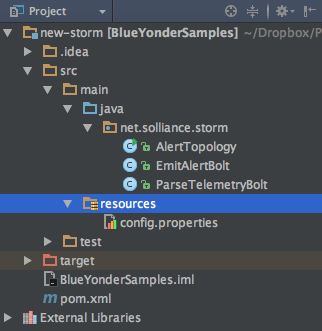
Figure 4-8. The config.properties file holds the connection information to Event Hubs.
Open config.properties and specify the following settings (Example 4-1):
eventhubspout.username-
The policy name with read permissions to Event Hubs
eventhubspout.password-
The primary key for the aforementioned policy
eventhubspout.namespace-
The service bus namespace containing your Event Hubs instance
eventhubspout.entitypath-
The name of your Event Hubs instance
eventhubspout.partitions.count-
The number of partitions your Event Hubs instance contains
Example 4-1. Example configuration settings for the Event Hub Spout in config.properties
eventhubspout.username = reader

eventhubspout.password = zotQvVFyStprcSe4LZ8Spp3umStfwC9ejvpVSoJFLlU=

eventhubspout.namespace = blueyonderairports-ns

eventhubspout.entitypath = blueyonderairports

eventhubspout.partitions.count = 4
The rest of the settings should already have reasonable defaults and are described by the comments within the file, should you desire to understand the other “knobs” you can adjust.
Now you are ready to build the project. Storm projects are built with Maven, a build manager that is the recommended way to manage dependencies and define build steps for Storm projects. At its core is the Project Object Model, an XML document that describes the project structure, repositories (from which to acquire dependencies), the dependencies themselves, and any components needed during the build. You can view the pom.xml document in the project tree view, in the root of the project directory (Figure 4-9).

Figure 4-9. The pom.xml file, which configures dependencies and build settings.
IntelliJ IDEA provides a window that can execute the build steps as described in pom.xml. To view this window, select View→Tool Windows→Maven Projects. When you display this dialog, it should appear as shown in Figure 4-10.
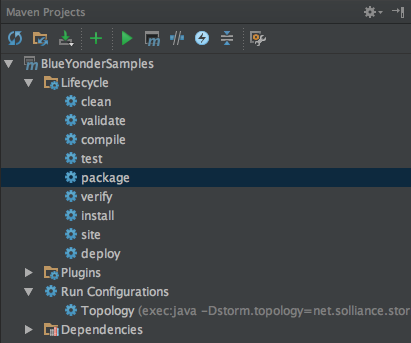
Figure 4-10. The Maven Projects window showing the actions that can be run on the project.
Double-click on “compile” to build the project, and make sure you do not have any build errors (which would appear in the window docked to the bottom of IntelliJ IDEA).
Topology implementation
Before we get to running the topology, let’s explore the implementation. We’ll start at the top, the topology, and then drill into the spouts and bolts.
If you open AlertTopology.java, you should notice the AlertTopology class consists of one static method, main; an empty constructor; and a few protected helper functions. The purpose of this class is to instantiate the various bolts and spouts needed by the topology and wire them together into a directed acyclic graph. The main method takes as its only input argument an array of strings, which will contain any command-line parameters used to launch the topology using the Storm command-line client. When the topology is run, this main method is invoked first.
publicstaticvoidmain(String[]args)throwsException{AlertTopologyscenario=newAlertTopology();StringtopologyName;StringconfigPropertiesPath;if(args!=null&&args.length>0){topologyName=args[0];configPropertiesPath=args[1];}else{topologyName="AlertTopology";configPropertiesPath=null;}scenario.loadAndApplyConfig(configPropertiesPath,topologyName);StormTopologytopology=scenario.buildTopology();scenario.submitTopology(args,topology);}
The main method implementation follows a typical pattern for Storm topologies: load configuration properties, build the topology, and submit the topology to run it.
Let’s look at each of these steps in detail, starting with the loading of configuration properties. Within AlertTopology.loadAndApplyConfig we have the following:
protectedvoidloadAndApplyConfig(StringconfigFilePath,StringtopologyName)throwsException{Propertiesproperties=loadConfigurationProperties(configFilePath);Stringusername=properties.getProperty("eventhubspout.username");Stringpassword=properties.getProperty("eventhubspout.password");StringnamespaceName=properties.getProperty("eventhubspout.namespace");StringentityPath=properties.getProperty("eventhubspout.entitypath");StringtargetFqnAddress=properties.getProperty("eventhubspout.targetfqnaddress");StringzkEndpointAddress=properties.getProperty("zookeeper.connectionstring");intpartitionCount=Integer.parseInt(properties.getProperty("eventhubspout.partitions.count"));intcheckpointIntervalInSeconds=Integer.parseInt(properties.getProperty("eventhubspout.checkpoint.interval"));intreceiverCredits=Integer.parseInt(properties.getProperty("eventhub.receiver.credits"));StringmaxPendingMsgsPerPartitionStr=properties.getProperty("eventhubspout.max.pending.messages.per.partition");if(maxPendingMsgsPerPartitionStr==null){maxPendingMsgsPerPartitionStr="1024";}intmaxPendingMsgsPerPartition=Integer.parseInt(maxPendingMsgsPerPartitionStr);StringenqueueTimeDiffStr=properties.getProperty("eventhub.receiver.filter.timediff");if(enqueueTimeDiffStr==null){enqueueTimeDiffStr="0";}intenqueueTimeDiff=Integer.parseInt(enqueueTimeDiffStr);longenqueueTimeFilter=0;if(enqueueTimeDiff!=0){enqueueTimeFilter=System.currentTimeMillis()-enqueueTimeDiff*1000;}StringconsumerGroupName=properties.getProperty("eventhubspout.consumer.group.name");System.out.println("Eventhub spout config: ");System.out.println(" partition count: "+partitionCount);System.out.println(" checkpoint interval: "+checkpointIntervalInSeconds);System.out.println(" receiver credits: "+receiverCredits);spoutConfig=newEventHubSpoutConfig(username,password,namespaceName,entityPath,partitionCount,zkEndpointAddress,checkpointIntervalInSeconds,receiverCredits,maxPendingMsgsPerPartition,enqueueTimeFilter);if(targetFqnAddress!=null){spoutConfig.setTargetAddress(targetFqnAddress);}spoutConfig.setConsumerGroupName(consumerGroupName);//set the number of workers to be the same as partition number.//the idea is to have a spout and a partial count bolt co-exist in one//worker to avoid shuffling messages across workers in storm cluster.numWorkers=spoutConfig.getPartitionCount();spoutConfig.setTopologyName(topologyName);minAlertTemp=Double.parseDouble(properties.getProperty("alerts.mintemp"));maxAlertTemp=Double.parseDouble(properties.getProperty("alerts.maxtemp"));}
As you can see, the gist of this method is to use the properties collection to retrieve string properties from the config.properties file and store the result either in a method local variable or a global instance variable. Take particular note of the creation of the spoutConfig variable, which is one such global variable. This instance of EventHubSpoutConfig represents all the settings the EventHubSpout will need in order to retrieve events from Events Hubs. Also, it is worth pointing out numWorkers. Recall that in Storm, workers represent threads running within an executor. This setting will be used when we build the topology. The last two lines in the method load the temperature below which an alert should be raised (minAlertTemp) and the temperature above which an alert should be raised (maxAlertTemp).
The loadConfigurationProperties method invoked at the beginning of loadAndApplyConfig is responsible for doing the actual loading of the properties collection—drawing the values either from a config.properties file indicated via a command-line argument (such as when running the topology using the Storm client) or defaulting to the copy of it embedded as a resource (which is needed when you’re running the topology locally in the debugger).
protectedPropertiesloadConfigurationProperties(StringconfigFilePath)throwsException{Propertiesproperties=newProperties();if(configFilePath!=null){properties.load(newFileReader(configFilePath));}else{properties.load(AlertTopology.class.getClassLoader().getResourceAsStream("config.properties"));}returnproperties;}
The next method to be called, from main, is buildTopology. This method creates an instance of the EventHubSpout, passing in the spoutConfig previously created. Then an instance of TopologyBuilder is used to tie each of the topology components together.
The call to builder.setSpout is how the spout for the topology is added. The first parameter provides the name of the spout (as well as names the stream of tuples it emits), the second parameter provides the instance of the spout constructed, and the third sets the initial parallelism that configures the initial number of executor threads allocated to the spout. The intent of setting the initial parallelism is to have one thread available for each partition in Event Hubs.
The chained call to setNumTasks controls the number of task instances. The value for the call to setNumTasks is also set to the number of partitions. Together, the initial parallelism and declaration of the number of tasks ensure that when the topology runs, there will always be one EventHubSpout instance actively running per partition in Event Hubs.
This warrants a little explanation. While the initial parallelism controls the number of threads allocated to a spout, the number of tasks controls how many instances of the spout are run across the topology. If the number of tasks equals the initial parallelism—for example, if you have four tasks and an initial parallelism of 4, then each spout instance will run on its own thread. You can “double up” tasks on a thread, running multiple spout instances per thread if the number of tasks is greater than the initial parallelism. When it comes to consuming from Event Hubs, the best practice to achieve the highest throughput is to have one consuming thread dedicated to a spout instance that is able to retrieve messages from one partition without interruption.
protectedStormTopologybuildTopology(){TopologyBuilderbuilder=newTopologyBuilder();EventHubSpouteventHubSpout=newEventHubSpout(spoutConfig);builder.setSpout("EventHubSpout",eventHubSpout,spoutConfig.getPartitionCount()).setNumTasks(spoutConfig.getPartitionCount());builder.setBolt("ParseTelemetryBolt",newParseTelemetryBolt(),4).localOrShuffleGrouping("EventHubSpout").setNumTasks(spoutConfig.getPartitionCount());builder.setBolt("EmitAlertBolt",newEmitAlertBolt(minAlertTemp,maxAlertTemp),4).localOrShuffleGrouping("ParseTelemetryBolt").setNumTasks(spoutConfig.getPartitionCount());returnbuilder.createTopology();}
The next line is the first call to builder.setBolt. Here we configure the number of tasks and the initial parallelism as before, but we don’t have the requirement of having as many executor threads initially, so we can set it to a different value than the number of partitions. This line creates an instance of the ParseTelemetryBolt.
To configure the ParseTelemetryBolt so it gets its input tuples from the EventHubSpout, we reference the latter by name in the localOrShuffleGrouping chained method. The localOrShuffleGrouping provides an optimization in selecting the instance of the bolt that will receive tuples from the instance of a spout. If a spout and an instance of the bolt are running within the same worker process, then this localOrShuffleGrouping prefers to use that bolt instance rather than any of the other instances running within other worker processes. This avoids having to send the tuple over the network to a remote bolt. However, if no local bolt is available, then the tuple is sent to a randomly selected bolt.
The final call to builder.setBolt creates an instance of the EmitAlertBolt, which takes in its constructor the minimum and maximum values used to control the range outside of which an alert tuple is created. The EmitAlertBolt is configured to receive its input tuples from the ParseTelemetryBolt, again using a localOrShuffleGrouping.
The final line creates the actual instance of the topology, which we can submit to Storm to execute. This execution happens in the last line of main, which calls scenario.submitTopology, passing it any command-line arguments and the instance of the topology constructed. The implementation of submitTopology is as follows:
protectedvoidsubmitTopology(String[]args,StormTopologytopology)throwsException{Configconfig=newConfig();config.setDebug(false);if(args!=null&&args.length>0){StormSubmitter.submitTopology(args[0],config,topology);}else{config.setMaxTaskParallelism(2);LocalClusterlocalCluster=newLocalCluster();localCluster.submitTopology("test",config,topology);Thread.sleep(600000);localCluster.shutdown();}}
The goal of the submitTopology method is to support another common Storm pattern—to enable you to run the topology locally or against a Storm cluster. An instance of Config is created that wraps the settings Storm will use when running the topology. Next, we pass false to the call config.setDebug to minimize the logging (setting it to true would mean Storm logs details every time a tuple is received or emitted). After that, we examine the args array of command-line parameters. If we have command-line parameters, then by convention we know we want to run it against a Storm cluster. To do so, we use the submitTopology method of the Storm class, passing it the first argument (the name of the topology), the Config instance, and the topology we built. If we do not have any args, we create an instance of LocalCluster, call submitTopology against that, and wait for 10 minutes (600,000 ms) in the Thread.sleep before automatically shutting down the local cluster (without the sleep call, the cluster would shut down before the topology even gets going).
Since we are processing telemetry from Event Hubs, we do not need to implement a spout for that. The EventHubsSpout is a part of the Storm core libraries. So we will jump into the implementation of the bolts.
Let’s take a look at the ParseTelemetryBolt. Recall that the objective of this bolt is to take the input tuple, which contains the telemetry data in the form of a JSON serialized string, and turn it into a tuple with fields for each property (temperature, create date, and device ID). This class overrides the two key methods of BaseBasicBolt: execute and declareOutputFields.
The declareOutputFields method is called before the bolt begins executing, and its purpose is to indicate the names of the fields that will be emitted in the tuples created by this bolt. Think of it as declaring the schema of the output of the bolt, without explicitly describing the types of the fields, just the names. In our case, the output bolt from this will be a tuple that contains three fields: temp, createDate, and deviceId.
The execute method is called by Storm whenever there is a tuple to process by the bolt. The collector parameter is used to emit the bolt after this method has finished its processing. In the implementation, we use the Jackson library to parse the JSON string into an object, and we check if it has a temp field. If it does, we assume this a temperature reading tuple (as opposed to a motion sensor or HVAC reading) and we create a new tuple using the Values class, passing into its constructor the value for each field in the same order as the fields were declared in declareOutputFields. Finally, we emit the tuple for processing by downstream bolts via the call to collector.emit.
Observe that this class extends BaseBasicBolt. This is the class to use when you want Storm to automatically acknowledge successful processing of an input tuple when the execute method completes without error.
publicclassParseTelemetryBoltextendsBaseBasicBolt{privatestaticfinallongserialVersionUID=1L;publicvoidexecute(Tupleinput,BasicOutputCollectorcollector){Stringvalue=input.getString(0);ObjectMappermapper=newObjectMapper();try{JsonNodetelemetryObj=mapper.readTree(value);if(telemetryObj.has("temp"))//assume must be a temperature reading{Valuesvalues=newValues(telemetryObj.get("temp").asDouble(),telemetryObj.get("createDate").asText(),telemetryObj.get("deviceId").asText());collector.emit(values);}}catch(IOExceptione){System.out.println(e.getMessage());}}publicvoiddeclareOutputFields(OutputFieldsDeclarerdeclarer){declarer.declare(newFields("temp","createDate","deviceId"));}}
Now let’s turn our attention to the implementation of the EmitAlert bolt. We follow the same basic pattern as before. In this case we declare the schema of our output tuples to have one additional field, reason, in addition to the fields we have in a temperature tuple. Within the execute method, we look at the value of the temperature received from the incoming tuple, and if it’s outside of the bounds we emit a new tuple with the reading’s value and the reason.
publicclassEmitAlertBoltextendsBaseBasicBolt{privatestaticfinallongserialVersionUID=1L;protecteddoubleminAlertTemp;protecteddoublemaxAlertTemp;publicEmitAlertBolt(doubleminTemp,doublemaxTemp){minAlertTemp=minTemp;maxAlertTemp=maxTemp;}publicvoidexecute(Tupleinput,BasicOutputCollectorcollector){doubletempReading=input.getDouble(0);StringcreateDate=input.getString(1);StringdeviceId=input.getString(2);if(tempReading>maxAlertTemp){collector.emit(newValues("reading above bounds",tempReading,createDate,deviceId));System.out.println("Emitting above bounds: "+tempReading);}elseif(tempReading<minAlertTemp){collector.emit(newValues("reading below bounds",tempReading,createDate,deviceId));System.out.println("Emitting below bounds: "+tempReading);}}publicvoiddeclareOutputFields(OutputFieldsDeclarerdeclarer){declarer.declare(newFields("reason","temp","createDate","deviceId"));}}
With the tour of the code artifacts behind us, let’s turn to running the topology locally using IntelliJ IDEA. We will show two approaches: running the topology without the debugger, and running the topology with the debugger.
To run the topology without the debugger, use the Maven Projects window and under Run Configurations, double-click Topology (Figure 4-11).
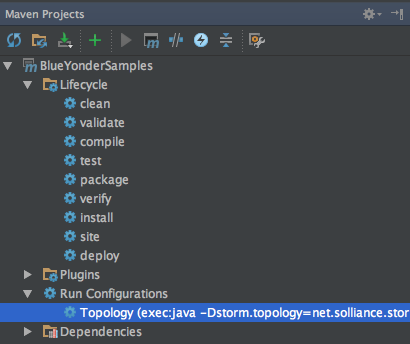
Figure 4-11. Double-click on Topology to run the topology without the debugger.
The output of any diagnostic information, including the out-of-bound messages produced by the EmitAlertBolt, will be shown in the bottom window (Figure 4-12).

Figure 4-12. Example of the output that will scroll by when you run the topology locally.
The process will automatically terminate, or you can press the “Stop process” button in the output dialog (the red square) to terminate on demand.
To run the topology with the debugger attached—and thereby stop at any breakpoints, allowing you to inspect variables and step through the code—from the Run menu choose Debug “Topology.” When it is running you can use the controls in the Debug window to step into, step over, and step out of code, as well as examine frames, threads, and variables when you have hit a breakpoint (Figure 4-13).
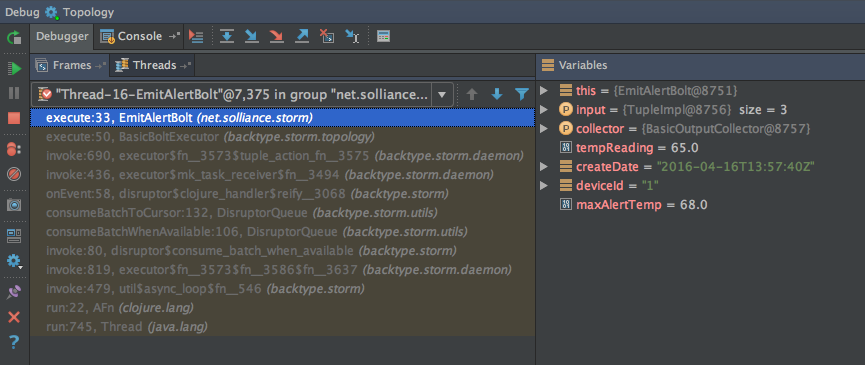
Figure 4-13. The Debug window.
This sample project has been provided with the configuration topology. It is useful to understand how this build configuration was created so that you can apply it in your own Storm projects. From the Run menu, select Edit Configurations.
Notice in the tree that a Maven configuration was added (traditionally you’d do this by clicking the + and choosing Maven in the Add New Configuration dialog). In the tree, select the Topology entry. The working directory should be set to the root of your Storm project directory. The command line should be set to use the Maven exec plugin to run the java command, passing it the fully qualified name of your Storm topology via the Dstorm.topology parameter (Figure 4-14). To be able to run another topology you create in the future, alter this parameter to have a value of the class name of your new topology.

Figure 4-14. The configuration needed to run topologies locally.
Now that we have run the topology locally, we’ll turn to running it in a production cluster. Naturally, in order to do that, we first need a Storm cluster, which we will achieve by provisioning an HDInsight cluster that is running Storm on Linux.
Provisioning the Linux HDI cluster
To provision a minimal Linux HDInsight Cluster with Storm, follow these steps:
-
Log in to the Azure Portal.
-
Select New→Intelligence + Analytics→HDInsight.
-
On the New HDInsight blade, provide a unique name for your cluster.
-
Choose your Azure subscription.
-
Click “Select Cluster configuration.”
-
On the “Cluster type configuration” blade, set the cluster type to Storm, operating system to Linux, version to Storm 0.10.0 (you can use any version of HDP, so long as it uses this version of Storm for compatibility with the sample), and leave cluster tier to Standard. Click Select.
-
Click “credentials.”
-
Set the admin login username and password, then the SSH username and password, and click Select (Figure 4-15).

Figure 4-15. Configuring authentication to HDInsight cluster.
-
Click Data Source.
-
Select an existing Azure Storage account or create a new one as desired (Figure 4-16).
-
Modify the container name as desired. This container name will act as the root folder for your HDInsight cluster.

Figure 4-16. Configuring storage for the cluster.
-
Choose the location nearest you.
-
Click Select.
-
Click Node Pricing Tiers.
-
Set the number of supervisor nodes to 1 (you do not need more to run the sample), as shown in Figure 4-17.

Figure 4-17. Configuring the cluster size.
-
Click View All.
-
Click A2 and click Select to change the tier to A2 (you will not need a more powerful Zookeeper host for this sample).
-
Click Select on the Node Pricing Tiers blade.
-
Click resource group and select an existing resource group or create a new one as desired. You should now have all the settings specified (Figure 4-18).
-
Click Create to begin creating the HDInsight cluster. It will take about 25 minutes to complete. When it’s ready, continue with the next section to run the topology.

Figure 4-18. Overview of the cluster configuration.
Running the topology on HDI
In order to run a topology on HDInsight, you need to package the topology and all of its dependencies (excepting Storm) into an uber (aka fat) JAR. Then you will need to use the SCP utility to upload the JAR and its config.properties file to the cluster head node. You run the topology by using SSH to connect to the cluster head node, and then use the Storm client to run the topology. You can monitor the status and view logs of the running topology via the Storm UI, which is accessed by a web browser.
Let’s walk through each of these steps, starting with packaging the uber JAR. To build the uber JAR, with the project open in IntelliJ IDEA, use the Maven Projects window and double-click on the package node (Figure 4-19). This will compile the project and create the uber JAR, with a name ending in "-jar-with-dependencies.jar.”
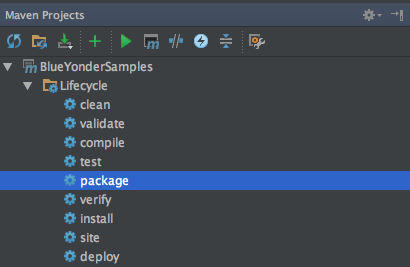
Figure 4-19. Use the package action to create the uber JAR.
Next, to upload the uber JAR and config file, you will need to use Secure Copy (SCP), which effectively copies files over SSH. The SCP utility is included with most Linux distributions in the bash shell. The syntax to upload any file via SCP to your HDInsight head node is as follows:
scp <localFileName> <userName>@<clusterName>-ssh.azurehdinsight.net:.
localFileName refers to the path on your local filesystem to the file you wish to upload. userName refers to the SSH user you created when provisioning the cluster. clusterName refers to the unique name you provided for your HDInsight cluster. Note there are a few subtle characters in the command as well. Right after the clusterName is a dash (-), and at the end after .net there is a colon (:) followed by a period (.).
When you run the SCP command, you will be prompted for the password associated with the SSH username. Enter that, and your upload will commence. In the context of the sample, to upload the uber JAR and the config.properties file, we could run the following two commands:
scp ./target/BlueYonderSamples-1.0.0-jar-with-dependencies.jar
zoinertejada@solstorm0-10-0-ssh.azurehdinsight.net:.
scp ./target/config.properties
zoinertejada@solstorm0-10-0-ssh.azurehdinsight.net:.
Now that you have your topology JAR and its config uploaded to the head node, you need to run it using the Storm client, which is run from bash when you are connected to the head node via SSH.
To SSH into the head node of your HDInsight cluster, the command looks as follows:
ssh <userName>@<clusterName>-ssh.azurehdinsight.net
The parameters enclosed in angle brackets have the same meaning as for the SCP command. For example, here is what we used to SSH into our cluster:
ssh zoinertejada@solstorm0-10-0-ssh.azurehdinsight.net
When you connect, you will be prompted for the password associated with the SSH username. With the SSH connection established, you use the Storm client as follows:
storm jar <uber.jar> <className> <topologyName> <…topology specific params…>
The uber.jar parameter should have as its value the name of the uber JAR you uploaded via SCP. The className parameter should be set to the fully qualified name of the class that defines your topology. The topologyName is the name of the topology as it will appear when Storm runs it (i.e., in the monitoring UIs and when you want to manage a topology, you provide this name). Finally, each topology implementation can require its own set of additional command-line parameters after the topologyName. In our AlertTopology, we require the name of the file that contains the configuration properties, as follows:
storm jar BlueYonderSamples-1.0.0-jar-with-dependencies.jar
  net.solliance.storm.AlertTopology alerts config.properties
When the storm command is run, it will kick off the topology and then return. To monitor the status of the topology, you can used the browser-based Storm UI.
To access the Storm UI, open your favorite web browser and navigate to https://<clusterName>.azurehdinsight.net/stormui.
When you first do so, you will be prompted to enter the admin username and password you established when you created the cluster. Note that you should not use the SSH username and password in this case.
The first view that loads provides you with a high-level summary of the Storm cluster (Figure 4-20).

Figure 4-20. The top-level view of the Storm UI.
The view provides five sections:
- Cluster Summary
-
Describes the top-level layout of the cluster, the version of Storm being run, the number of supervisor virtual machines (Supervisors column), the number of worker processes deployed (Total slots), the number of worker processes used (Used slots) and unused (Free slots), the number of executor threads (Executors), and the number of tasks across the cluster (Tasks).
- Nimbus Summary
-
Provides a listing of all of the virtual machine nodes, indicating which nodes in the cluster are providing Nimbus primary (Status is Leader) and secondary (Status is Not a Leader) functionality.
- Topology Summary
-
Lists all the topologies currently deployed to the cluster, whether they are actively running (Status), and their consumption of the cluster resources (Num workers, Num tasks).
- Supervisor Summary
-
Lists the virtual machine nodes that are running as supervisor nodes.
- Nimbus Configuration
-
Provides a read-only view into the Nimbus settings that are in effect.
To view the status for a topology, click on its name in the Topology Summary (Figure 4-21).
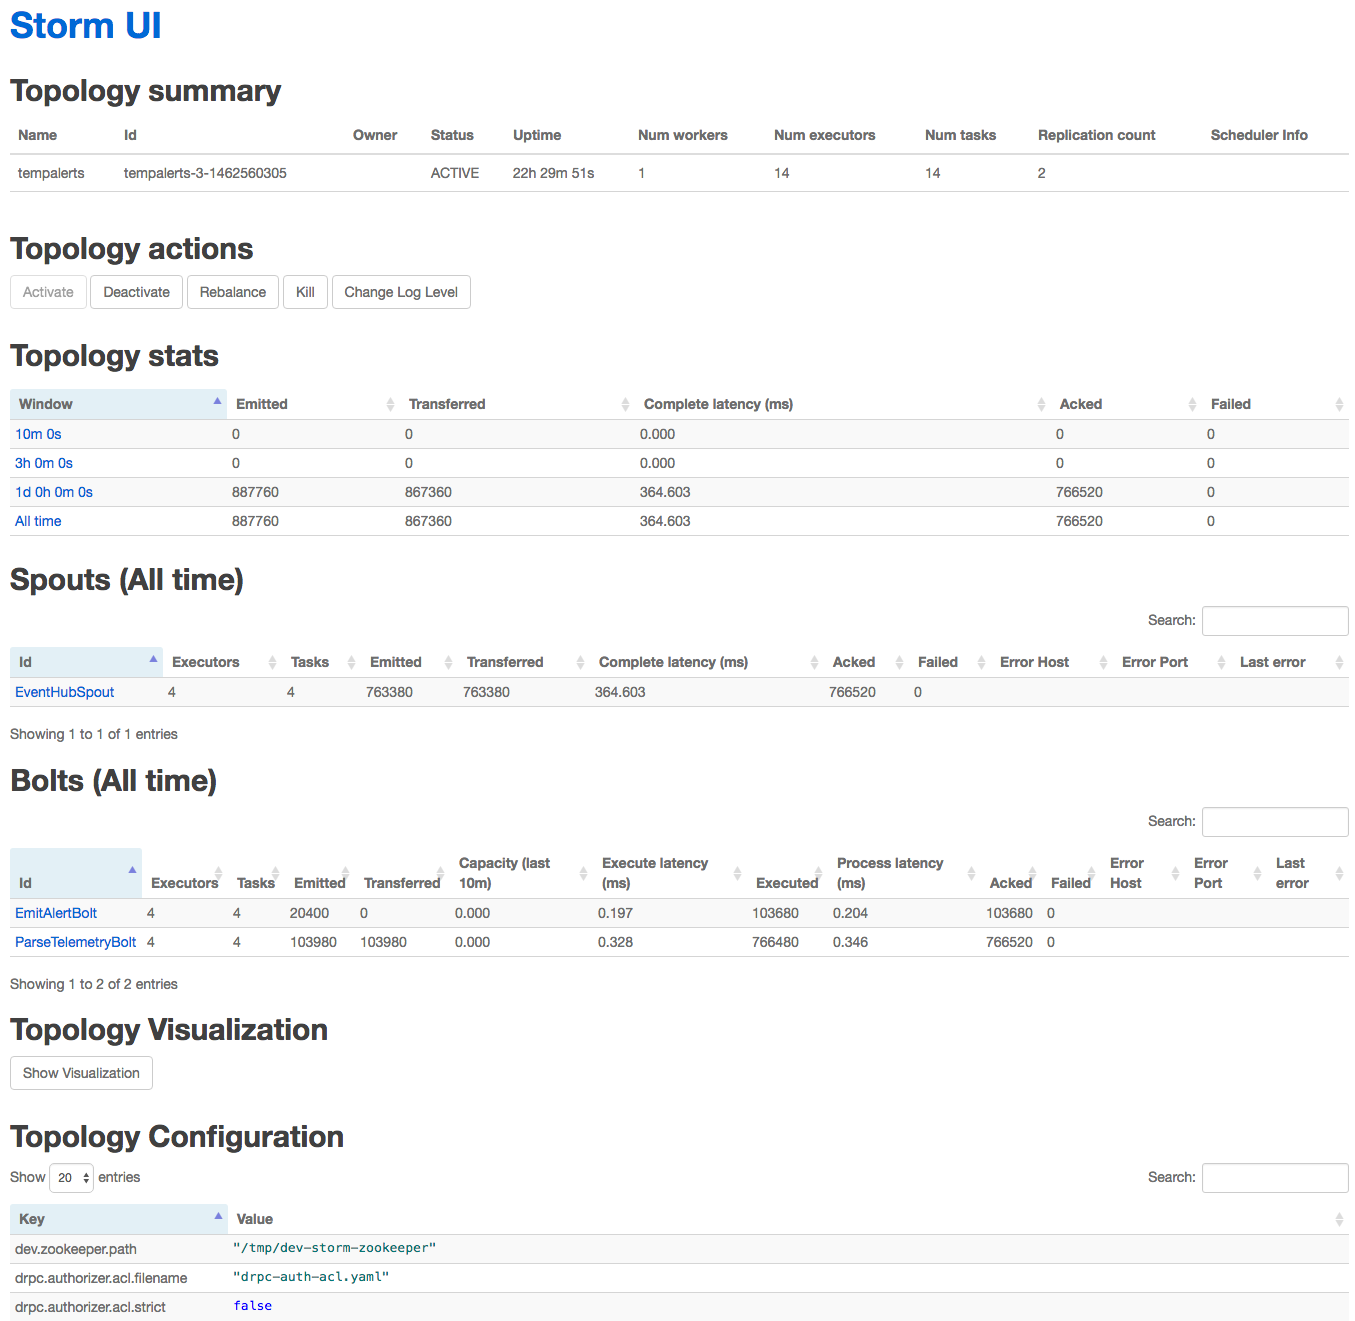
Figure 4-21. The topology view of the Storm UI.
The topology view has seven sections:
- Topology summary
-
Shows the same values as on the top-level, cluster-wide view.
- Topology actions
-
These buttons enable you to deactivate (pause) a running topology or activate (resume) a previously deactivated topology. You can click Rebalance to have Storm reallocate available executors and tasks to the topology. You click Kill to terminate the topology, which will also remove it from being listed in the Storm UI.
- Topology stats
-
These stats give the counts on the number of tuples emitted in total across all spouts and bolts (the Emitted column) and the number of tuples actually transferred between spouts and bolts or bolts and bolts (the Transferred column). These values may be different, for example, when a bolt emits a tuple, but there is not a downstream bolt to consume it. Acked indicates the number of tuples that were succesfully processed across all spouts and bolts, whereas Failed is the count of those that failed (typically where the spout or bolt threw an exception).
- Spouts
-
Provides the stats for each spout in the topology.
- Bolts
-
Provides the stats for each bolt in the topology.
- Topology Visualization
-
This should show a graph of the directed acyclic graph form of the topology, but is currently disabled in HDInsight.
- Topology Configuration
-
This is a read-only listing of the config properties provided when the topology was submitted.
If you click on the ID of a spout (in the Spouts listing) or a bolt (in the Bolts listing) you are taken to a detailed view for just that spout or bolt (Figure 4-22).
This provides similar statistics as the other views, with two interesting additions:
- Executors
-
Lists the executor threads in which instances of this bolt or spout are running.
- Errors
-
Lists the text of any runtime errors encountered across all instances of the spout or bolt.
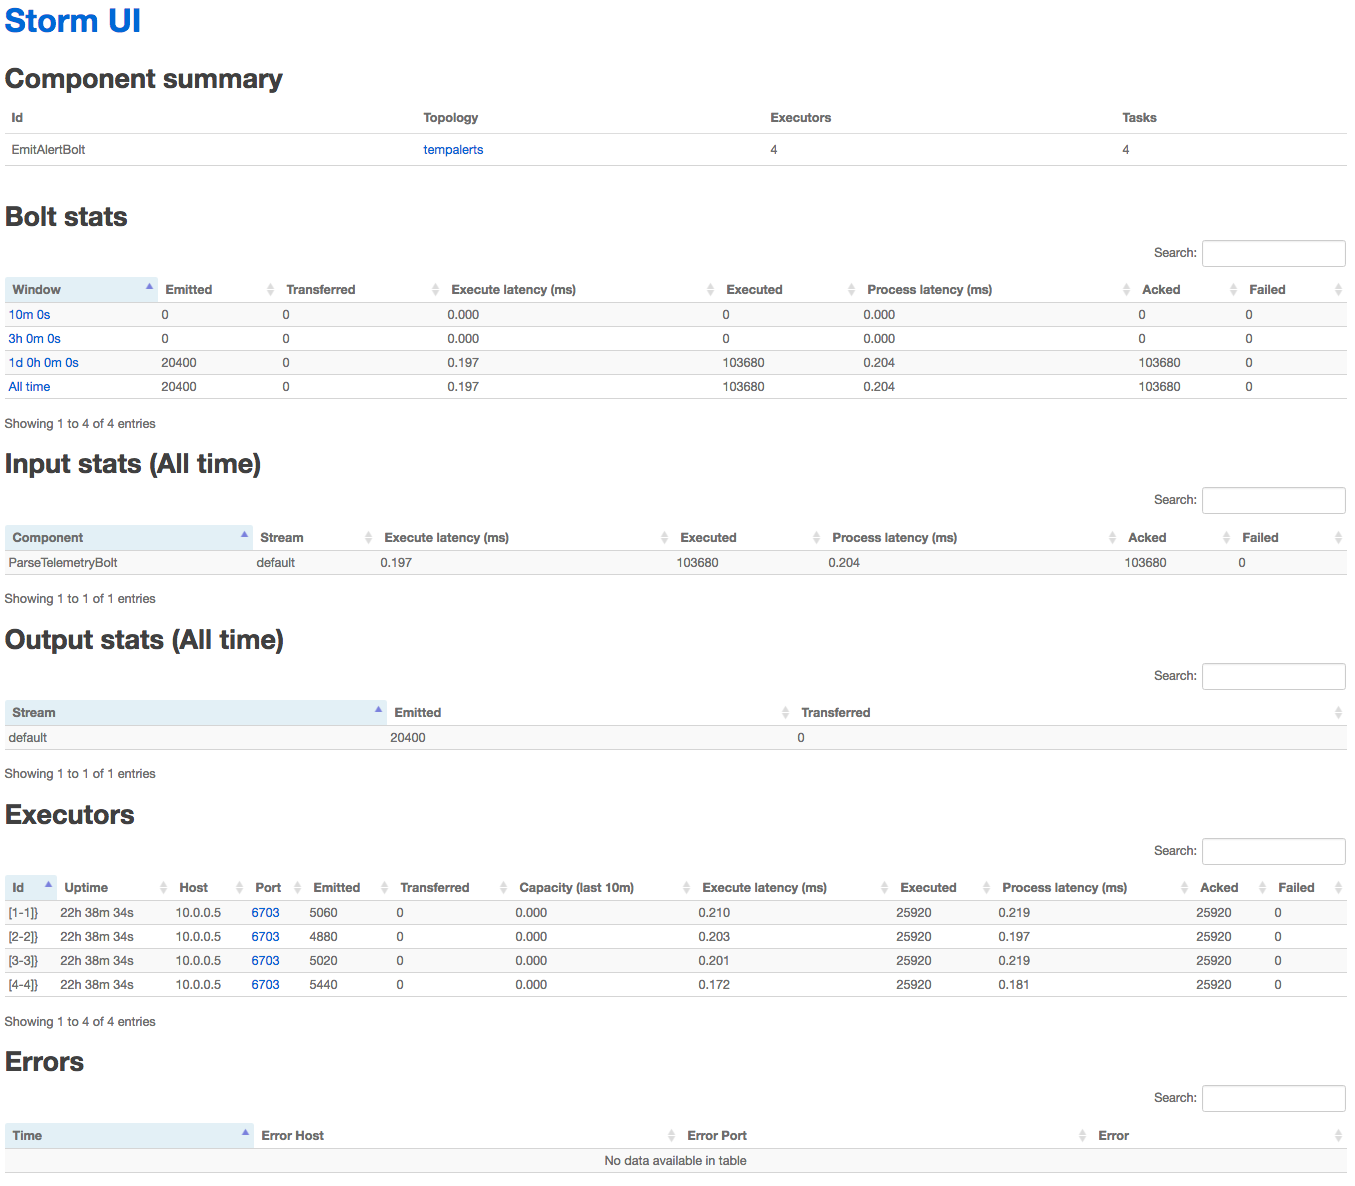
Figure 4-22. Viewing the details for the EmitAlertsBolt.
There is a subtlety to this UI that is worth understanding. If you want to view the log output from any instance of the spout or bolt, under the Executors listing click the hyperlinked port number. This will take you to a new screen where you can view the logs captured for any instance of the spout or bolt being run by the executor (Figure 4-23).

Figure 4-23. Viewing the logs for a bolt.
Alerting with Storm on HDInsight (C# + Windows cluster)
In addition to the Java implementation we demonstrated, Storm topologies can also be implemented in C#. In fact, in this approach, you can build hybrid topologies that are a mix of components written in C# and Java—effectively allowing you to get the best from both worlds. The primary requirement is that topologies implemented in C# can run only on Storm on HDInsight clusters running Windows.
In this section we will look at implementing the same alerting topology we showed previously in Java. Here we will use the Java EventHubSpout that is included with Storm, but implement our ParserBolt and EmitAlertBolt using C#. The topology itself will also be defined using C#.
Let’s begin by setting up your development environment.
Dev environment setup
Building Storm topologies with C# requires Visual Studio 2015. However, you can use any edition of VS 2015, from the free Community edition to the premium Enterprise edition.
You will also want to ensure you have the Microsoft Azure HDInsight Tools for Visual Studio installed, which provide you with projects ranging from empty Storm projects to hybrid topologies that read from Event Hubs.
With Visual Studio properly updated, the next step is to download and open the Blue Yonder Airports sample in Visual Studio.
You can download the Storm sample from http://bit.ly/2buuAwT.
The download includes the AlertTopology sample as a Visual Studio solution with a single project that contains the topology, spouts, and bolts.
Once you have downloaded the sample, open the solution in Visual Studio. You should now be ready to explore the project. In Solution Explorer, expand the ManagedAlertTopology project. You should see the three classes that define the topology (AlertTopology.cs), the parser bolt (ParserBolt.cs), and the alert bolt (EmitAlertBolt.cs), as shown in Figure 4-24.
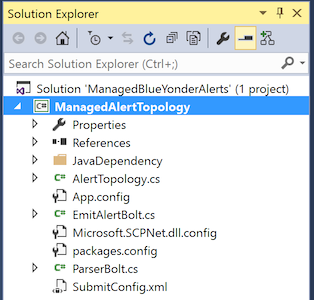
Figure 4-24. The files contained in the managed Storm project.
Next, expand JavaDependency. This is your first peek into how hybrid C# plus Java projects are structured. The JavaDependency folder contains a single JAR file that contains the Java-based EventHubSpout (Figure 4-25).

Figure 4-25. The JAR containing the EventHubSpout implementation.
We will walk through the implementation shortly, but first let’s finish preparing the solution for build and deployment. Open app.config and set the values in appSettings as follows to enable the EventHubSpout to connect your instance of Event Hubs:
EventHubNamespace-
The service bus namespace containing your Event Hubs instance
EventHubEntityPath-
The name of your Event Hubs instance
EventHubSharedAccessKeyName-
The policy name with read permissions to Event Hubs
EventHubPartitions-
The number of partitions your Event Hubs instance contains
Save app.config and from the Build menu, select “Build solution.” Verify that you do not get any build errors.
Topology implementation
C# topologies are enabled via the Stream Computing Platform for .NET (SCP.NET). This platform provides both the plumbing to interact with Storm’s native Java runtime, as well as classes for implementing topologies, spouts, and bolts. If you are comfortable with our previous illustration of the AlertTopology implemented with Java, then you should find most of the implementation in C# very familiar. There are a few differences, and we will call them out as we proceed.
Let’s begin by examining AlertTopology.cs:
[Active(true)]publicclassAlertTopology:TopologyDescriptor{publicITopologyBuilderGetTopologyBuilder(){TopologyBuildertopologyBuilder=newTopologyBuilder("AlertTopology");vareventHubPartitions=int.Parse(ConfigurationManager.AppSettings["EventHubPartitions"]);topologyBuilder.SetEventHubSpout("EventHubSpout",newEventHubSpoutConfig(ConfigurationManager.AppSettings["EventHubSharedAccessKeyName"],ConfigurationManager.AppSettings["EventHubSharedAccessKey"],ConfigurationManager.AppSettings["EventHubNamespace"],ConfigurationManager.AppSettings["EventHubEntityPath"],eventHubPartitions),eventHubPartitions);List<string>javaSerializerInfo=newList<string>(){"microsoft.scp.storm.multilang.CustomizedInteropJSONSerializer"};varboltConfig=newStormConfig();topologyBuilder.SetBolt(typeof(ParserBolt).Name,ParserBolt.Get,newDictionary<string,List<string>>(){{Constants.DEFAULT_STREAM_ID,newList<string>(){"temp","createDate","deviceId"}}},eventHubPartitions,true).DeclareCustomizedJavaSerializer(javaSerializerInfo).shuffleGrouping("EventHubSpout").addConfigurations(boltConfig);topologyBuilder.SetBolt(typeof(EmitAlertBolt).Name,EmitAlertBolt.Get,newDictionary<string,List<string>>(){{Constants.DEFAULT_STREAM_ID,newList<string>(){"reason","temp","createDate","deviceId"}}},eventHubPartitions,true).shuffleGrouping(typeof(ParserBolt).Name).addConfigurations(boltConfig);vartopologyConfig=newStormConfig();topologyConfig.setMaxSpoutPending(8192);topologyConfig.setNumWorkers(eventHubPartitions);topologyBuilder.SetTopologyConfig(topologyConfig);returntopologyBuilder;}}
The first thing that might jump out at you is the use of the Active attribute atop the class declaration. In the Java approach, we provided a static Main method that kicked off the topology construction, and we selected which class’s Main method to invoke when we actually ran the topology using the Storm client. With SCP.NET, the Active attribute (when set to true) indicates that this is the one and only class within the assembly that should be used to build the topology.
The topology class derives from TopologyDescriptor and implements only a single public method: GetTopologyBuilder. This method takes the place of the Main method we used in Java. Within it, we create an instance of TopologyBuilder, give it a name, and then attach spouts and bolts, via the SetSpout, SetBolt, and more specialized SetEventHubSpout methods.
In the constructor of TopologyBuilder, we provide the runtime name of the topology. This can have almost whatever value you desire, but there is an important caveat when you are working with the EventHubSpout. Recall that when reading from the Event Hub partition, the spout tasks periodically checkpoint their progress with Zookeeper. Their progress is effectively grouped underneath the name of the topology provided to the constructor of TopologyBuilder. This means that if you resubmit a Storm topology with the same name, the EventHubSpouts will resume where they left off. If you want the spouts to start from the beginning of each Event Hubs partition, then be sure to provide a unique name that has not been used before.
In building the EventHubSpout, we load from the app.config the settings needed for the Event Hub and use them to populate an instance of EventHubSpoutConfig. The call to setEventHubSpout takes three arguments: a name for the component, the EventHubSpoutConfig, and the initial parallelism hint (i.e., the initial number of threads to allocate, which should be one thread per partition).
Moving to the call to topologyBuilder.setBolt, we provide the method the name for the component, a reference to the method for constructing instances of the bolt, a dictionary that lists the names of the fields emitted by the bolt, the initial parallelism hint, and a boolean that enables or disables tuple ack. This latter property must be set to true for topologies that consume from the EventHubSpout, since the spout itself will keep in memory (for the purposes of resiliency) any tuples that have not been acknowledged and will error out after a certain threshold is reached of unacknowledged tuples. This setting means that downstream bolts must also ack all the tuples with a lineage tracing back to the EventHubSpout. In the Java implementation, this was done automatically for us via the implementation of BasicBolt. In SCP.NET we have a little extra work to do, which we will demonstrate shortly.
Right after the closing parenthesis of topologyBuilder.setBolt, we chain on a call to DeclareCustomizedJavaSerializer and pass it the dictionary that names the Java-based type of the serializer to use. The purpose of this call is to take the tuples that are traditionally serialized using Java, and instead serialize them as JSON so our .NET bolts can properly deserialize them.
Finally, observe that in this chain that follows setEventHubSpout, we invoke shuffleGrouping and reference the name of the EventHubSpout component to flow tuples from the EventHubSpout to this ParserBolt.
The second call to topologyBuilder.setBolt works in an almost identical fashion, but with one exception. In this case, we are flowing tuples from the ParserBolt to the EmitAlertBolt—both of which are C# components. In this case we do not need to inject a serializer.
Next, let’s look at the implementation for ParserBolt.cs. Bolts need to implement the ISCPBolt interface, which only defines the Execute method that takes a tuple as input. In reality, you will commonly also implement a constructor that defines the input and output schema as well as any serializer or deserializer required, and a Get method that acts as a factory method to construct instances of the bolt.
publicclassParserBolt:ISCPBolt{Context_context;publicParserBolt(Contextctx){this._context=ctx;// set input schemasDictionary<string,List<Type>>inputSchema=newDictionary<string,List<Type>>();inputSchema.Add(Constants.DEFAULT_STREAM_ID,newList<Type>(){typeof(string)});// set output schemasDictionary<string,List<Type>>outputSchema=newDictionary<string,List<Type>>();outputSchema.Add(Constants.DEFAULT_STREAM_ID,newList<Type>(){typeof(double),typeof(string),typeof(string)});// Declare input and output schemas_context.DeclareComponentSchema(newComponentStreamSchema(inputSchema,outputSchema));_context.DeclareCustomizedDeserializer(newCustomizedInteropJSONDeserializer());}publicvoidExecute(SCPTupletuple){stringjson=tuple.GetString(0);varnode=JObject.Parse(json);vartemp=node.GetValue("temp");JTokentempVal;if(node.TryGetValue("temp",outtempVal))//assume must be a//temperature reading{Context.Logger.Info("temp:"+temp.Value<double>());JTokencreateDate=node.GetValue("createDate");JTokendeviceId=node.GetValue("deviceId");_context.Emit(Constants.DEFAULT_STREAM_ID,newList<SCPTuple>(){tuple},newList<object>{tempVal.Value<double>(),createDate.Value<string>(),deviceId.Value<string>()});}_context.Ack(tuple);}publicstaticParserBoltGet(Contextctx,Dictionary<string,Object>parms){returnnewParserBolt(ctx);}}
Finally, let’s examine EmitAlertBolt.cs. It is very similar structurally to ParserBolt. Note that in this case the constructor does not define a deserializer because one is not needed in the C# object to C# object pipeline.
publicclassEmitAlertBolt:ISCPBolt{Context_context;double_minAlertTemp;double_maxAlertTemp;publicEmitAlertBolt(Contextctx){this._context=ctx;Context.Logger.Info("EmitAlertBolt: Constructor called");try{// set input schemasDictionary<string,List<Type>>inputSchema=newDictionary<string,List<Type>>();inputSchema.Add(Constants.DEFAULT_STREAM_ID,newList<Type>(){typeof(double),typeof(string),typeof(string)});// set output schemasDictionary<string,List<Type>>outputSchema=newDictionary<string,List<Type>>();outputSchema.Add(Constants.DEFAULT_STREAM_ID,newList<Type>(){typeof(string),typeof(double),typeof(string),typeof(string)});// Declare input and output schemas_context.DeclareComponentSchema(newComponentStreamSchema(inputSchema,outputSchema));_minAlertTemp=65;_maxAlertTemp=68;Context.Logger.Info("EmitAlertBolt: Constructor completed");}catch(Exceptionex){Context.Logger.Error(ex.ToString());}}publicvoidExecute(SCPTupletuple){try{doubletempReading=tuple.GetDouble(0);StringcreateDate=tuple.GetString(1);StringdeviceId=tuple.GetString(2);if(tempReading>_maxAlertTemp){_context.Emit(newValues("reading above bounds",tempReading,createDate,deviceId));Context.Logger.Info("Emitting above bounds: "+tempReading);}elseif(tempReading<_minAlertTemp){_context.Emit(newValues("reading below bounds",tempReading,createDate,deviceId));Context.Logger.Info("Emitting below bounds: "+tempReading);}_context.Ack(tuple);}catch(Exceptionex){Context.Logger.Error(ex.ToString());}}publicstaticEmitAlertBoltGet(Contextctx,Dictionary<string,Object>parms){returnnewEmitAlertBolt(ctx);}}
With an understanding of the managed topology in place, we’ll turn our attention to running the topology in HDInsight.
Provisioning the Windows HDI cluster
Provisioning an HDInsight cluster that runs Storm on Windows follows a similar process to that used for provisioning a Linux cluster. Follow these steps:
-
Log in to the Azure Portal.
-
Select New→Intelligence + Analytics→HDInsight.
-
On the New HDInsight blade, provide a unique name for your cluster.
-
Choose your Azure subscription.
-
Select “Cluster configuration.”
-
On the “Cluster type configuration” blade, set the cluster type to Storm, operating system to Windows, version to Storm 0.10.0, and the cluster tier to Standard. Click Select.
-
Click “credentials.”
-
Set the cluster login username and password, enable Remote Desktop (if desired) and set the Remote Desktop username and password, and click Select (Figure 4-26).
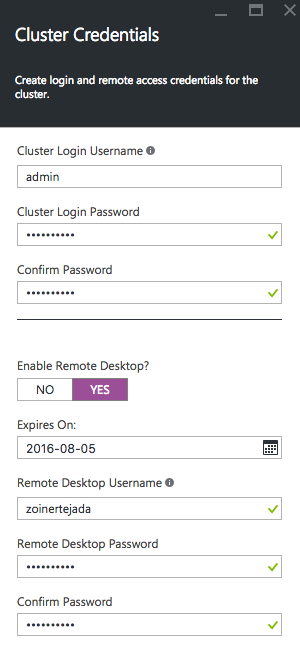
Figure 4-26. Setting the Windows-based cluster credentials.
-
Click Data Source.
-
Select an existing Azure Storage account or create a new one as desired.
-
Modify the container name as desired. This container name will act as the root folder for your HDInsight cluster.
-
Choose the location nearest you.
-
Click Select.
-
Click Node Pricing Tiers.
-
Set the number of supervisor nodes to 1 (you do not need more to run the sample).
-
Click on Zookeeper Nodes Pricing Tier.
-
Click View All.
-
Click A2 and click Select to change the tier to A2 (you will not need a more powerful Zookeeper host for this sample).
-
Click Select on the Node Pricing Tiers blade.
-
Click Resource Group and select an existing resource group or create a new one as desired. You should now have all the settings specified (Figure 4-27).
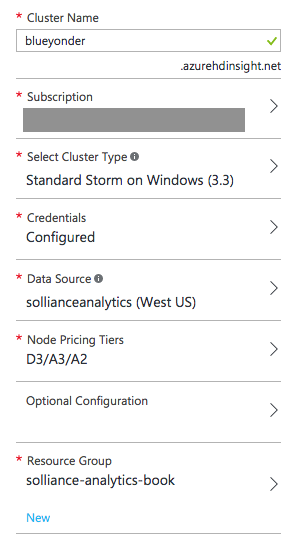
Figure 4-27. Overview of the cluster configuration.
-
Click Create to begin creating the HDInsight cluster. It will take about 25 minutes to complete. When it’s ready, continue with the next section to run the topology.
Running the topology on HDI
Thanks to the integration provided by the HDInsight Tools for Visual Studio, deploying and running a topology (even a hybrid one like we demonstrate here) can be done completely within Visual Studio 2015.
To begin, in Solution Explorer, right-click on your project and select “Submit to Storm on HDInsight” (Figure 4-28).
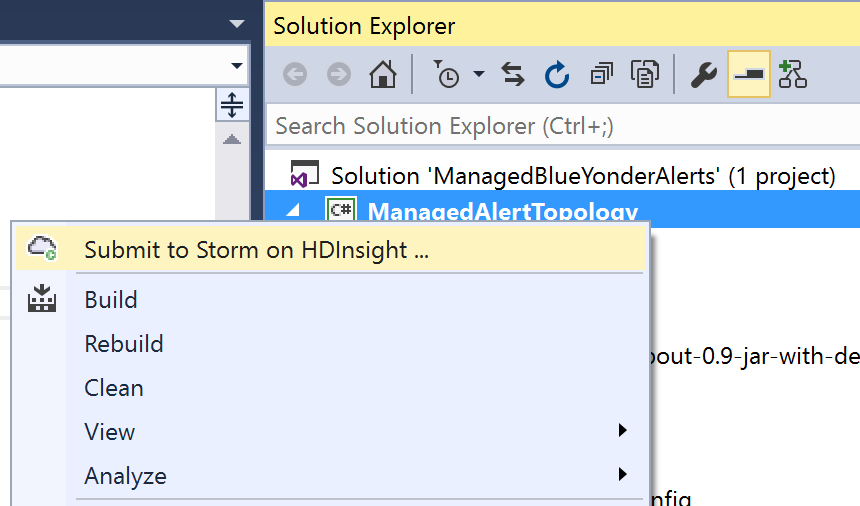
Figure 4-28. Submitting a topology project to HDInsight from within Visual Studio.
You will be prompted to log in with the credentials to your Azure subscription. When you have logged in, you will see the Submit Topology dialog (Figure 4-29).

Figure 4-29. The Submit Topology dialog within Visual Studio.
This dialog may take a few seconds to load the list of HDInsight clusters. You can see the progress in the background by looking at the HDInsight Task List, which will have an entry labeled “Get storm clusters list.”
When the list has loaded, select your HDInsight cluster from the Storm Cluster dropdown. Next, expand the Additional Configuration section. When creating a hybrid topology, this is where you indicate the folder containing any JARs to include with your Storm topology (Figure 4-30).
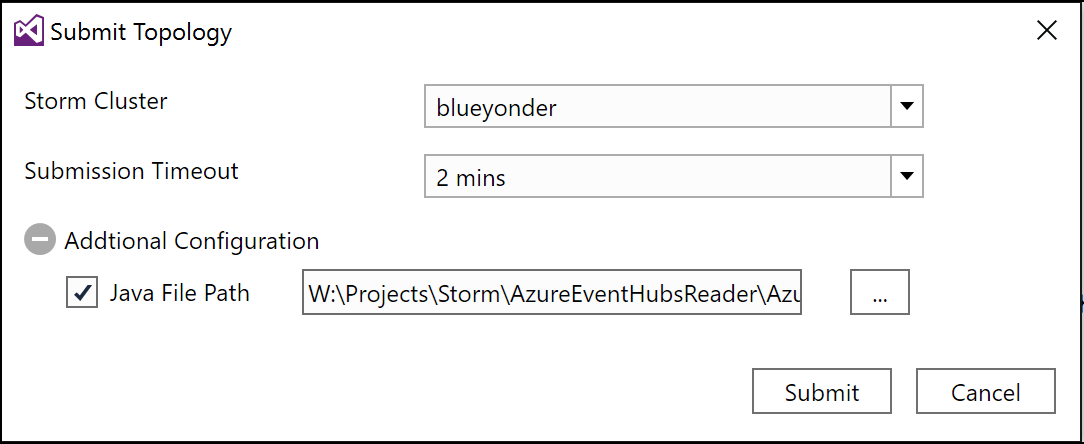
Figure 4-30. The Submit Topology dialog showing where to specify the folder containing JAR files used by a hybrid topology.
Click Submit to deploy and run your topology on your HDInsight cluster.
Once it has deployed, a new document named Storm Topologies View will appear. The lefthand pane will list all topologies deployed to the cluster (Figure 4-31).
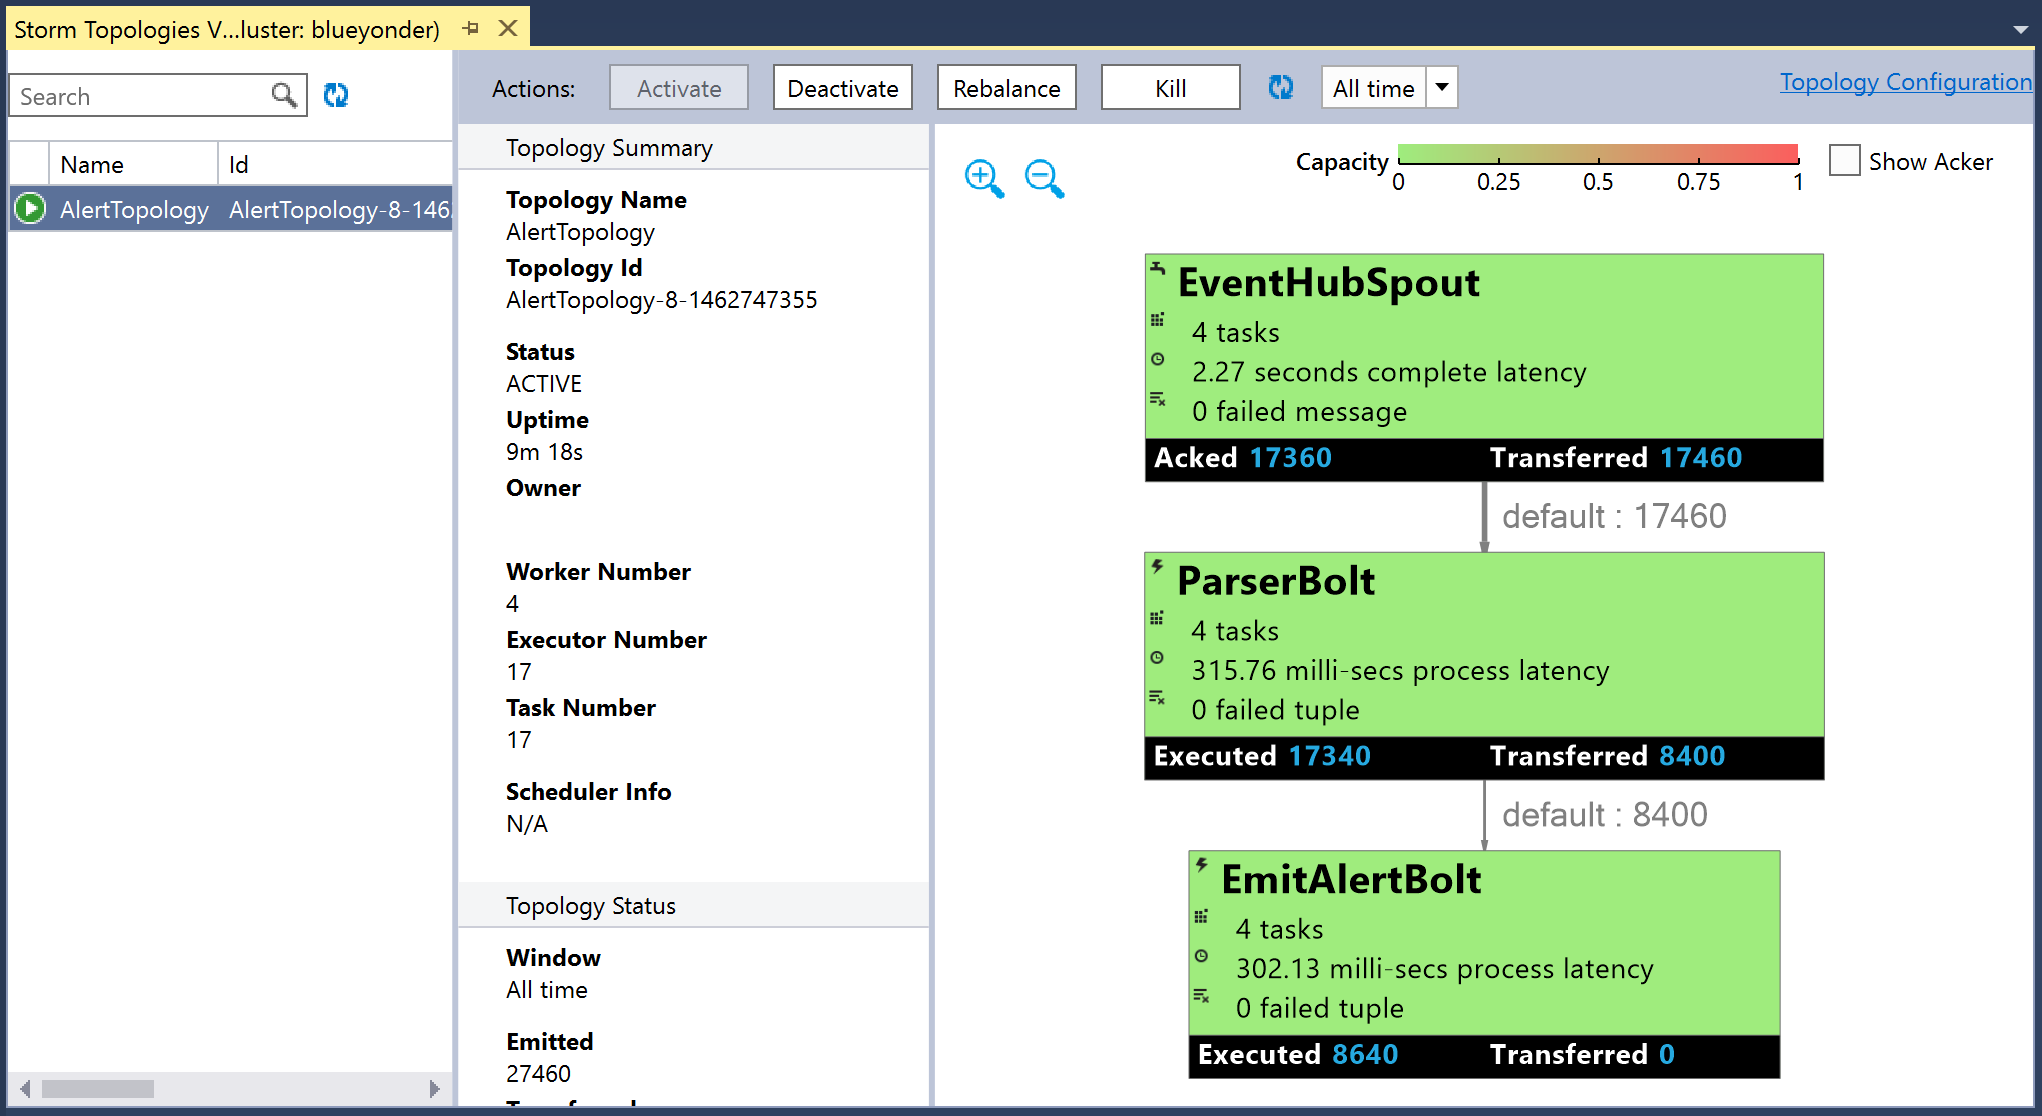
Figure 4-31. The Storm Topologies View displaying the status of a selected topology.
If you click on any one topology, you will get the visualization that summarizes the status.
On the visualization, if you double-click any of the components (e.g., the box representing a spout or bolt), you will be taken to a new document that is very similar to the Storm UI and presents the same statistics (Figure 4-32).

Figure 4-32. Viewing the statistics for a spout in Visual Studio.
In fact, if you click on the hyperlinked port for an executor, you can view the logs directly within Visual Studio (Figure 4-33).

Figure 4-33. Viewing the logs for an executor within Visual Studio.
You can always return to the Storm Topologies View by using Server Explorer, expanding the Azure and HDInsight nodes, and then right-clicking on the HDInsight cluster and selecting View Storm Topologies (Figure 4-34).

Figure 4-34. Using Server Explorer to access the Storm Topologies View.
EventProcessorHost
When you are developing with .NET and Visual Studio 2015, the recommended way to build scalable, fault-resilient consuming applications for Event Hubs is to use the EventProcessorHost class. EventProcessorHost takes care of:
-
Spawning a consumer for each partition in the Event Hubs instance
-
Checkpointing the state of each consumer periodically to Azure Blob Storage
-
Ensuring that there is always exactly one consumer per partition, and re-creating a new consumer should one fail
-
Managing epochs to enable updating of event processing logic
The EventProcessorHost class is available with the Azure Service Bus SDK, and can be found within the Microsoft.ServiceBus.Messaging.EventProcessorHost assembly. It can be hosted in a console application, a cloud service web or worker role, and even an Azure function, but the easiest place to host it is within a Web Job, which we demonstrate next.
EventProcessorHost in Web Jobs
Azure Web Jobs (a feature of Azure App Services) provide the compute environment for running many forms of tasks, from command-line applications to methods within a .NET assembly in response to triggers that can include messages in a queue and blobs being added to Blob Storage. Web Jobs also provide a tailored hosting environment for the EventProcessorHost, where new events can trigger the invocation of a processing method.
You can download the sample from http://bit.ly/2bJDLOi.
In this sample, we show how to accomplish the alert processing we have demonstrated throughout the chapter. Let’s begin with the implementation for the program that creates the Web Job host in Program.cs:
classProgram{privatestaticvoidMain(){vareventHubConnectionString=ConfigurationManager.AppSettings["eventHubConnectionString"];vareventHubName=ConfigurationManager.AppSettings["eventHubName"];varstorageAccountName=ConfigurationManager.AppSettings["storageAccountName"];varstorageAccountKey=ConfigurationManager.AppSettings["storageAccountKey"];varstorageConnectionString=$"DefaultEndpointsProtocol=https;AccountName={storageAccountName};AccountKey={storageAccountKey}";vareventHubConfig=newEventHubConfiguration();eventHubConfig.AddReceiver(eventHubName,eventHubConnectionString);varconfig=newJobHostConfiguration(storageConnectionString);config.NameResolver=newEventHubNameResolver();config.UseEventHub(eventHubConfig);varhost=newJobHost(config);host.RunAndBlock();}}
This is a common pattern for authoring Web Jobs. The code begins with the loading of the Event Hub connection string, the Event Hub name, and the Azure Storage account name and key from the appSettings contained within app.config.
Next, we create an instance of EventHubConfiguration and invoke the AddReceiver method to register that we want to listen for events at the Event Hub indicated by the parameters.
After that, we create an instance of JobHostConfiguration that takes in its constructor the connection string for an Azure Storage account. This account will be used to checkpoint the state of the consumers managed by this EventProcessorHost. We set the NameResolver property to an instance of EventHubNameResolver, a small utility class that helps us load the Event Hub name from appSettings, and provide it to the attribute we use to decorate the methods that respond to new events appearing in the Event Hub (we will show this attribute shortly). Finally, we invoke the UseEventHub method on the JobHostConfiguration instance to provide the Event Hub configuration.
Finally, we use the JobHostConfiguration as a parameter to the Web Job’s JobHost and then kick off the Web Job by the blocking call to host.RunAndBlock.
Let’s look at the implementation that actually handles the processing of events, in AlertsProcessor.cs:
publicclassAlertsProcessor{double_maxAlertTemp=68;double_minAlertTemp=65;publicvoidProcessEvents([EventHubTrigger("%eventhubname%")]EventData[]events){foreach(vareventDatainevents){try{vareventBytes=eventData.GetBytes();varjsonMessage=Encoding.UTF8.GetString(eventBytes);varevt=JObject.Parse(jsonMessage);JTokentemp;doubletempReading;if(evt.TryGetValue("temp",outtemp)){tempReading=temp.Value<double>();if(tempReading>_maxAlertTemp){Console.WriteLine("Emitting above bounds: "+tempReading);}elseif(tempReading<_minAlertTemp){Console.WriteLine("Emitting below bounds: "+tempReading);}}}catch(Exceptionex){LogError(ex.Message);}}}privatestaticvoidLogError(stringmessage){Console.ForegroundColor=ConsoleColor.Red;Console.WriteLine("{0} > Exception {1}",DateTime.Now,message);Console.ResetColor();}}
The attribute that ensures the ProcessEvents method is invoked when new events arrive at the Event Hub is the EventHubTriggerAttribute, applied to the first parameter of ProcessEvents. This attribute typically takes a string that is the name of the Event Hub:
publicvoidProcessEvents([EventHubTrigger("%eventhubname%")]EventData[]events)
To avoid hardcoding the name of the Event Hub, you can register a NameResolver as we did. We implement our NameResolver in the EventHubNameResolver class, whose Resolve method takes as input the name of the appSetting and returns the value. Resolve is invoked and the actual name of the Event Hub stored in configuration is passed to the EventHubTrigger constructor:
publicclassEventHubNameResolver:INameResolver{publicstringResolve(stringname){returnConfigurationManager.AppSettings[name].ToString();}}
Returning to ProcessEvents, once the method is invoked, we are provided with an array of events that we can process in the usual way. In this case we check if the JSON string contains a temp field. If so, we check if it is out of bounds and write a console message if it is. When ProcessEvents completes successfully (without throwing an exception), the EventProcessorHost running under the covers makes a checkpoint, persisting the progress through the partition to Azure Blob Storage. The Storage account used in this case to store checkpoints is the same account used by the Web Job. That’s all there is to it! This Web Job can be published to Azure and when it starts it will begin processing messages from the Event Hub.
Azure Machine Learning
While we have an upcoming chapter dedicated to Machine Learning and applying Cortana Intelligence components, it is worth mentioning how you might leverage Azure Machine Learning in the context of tuple-at-a-time processing. All the solutions in this chapter have shown how to process one tuple at a time. When you build a service using Azure Machine Learning and then operationalize it, you expose that Machine Learning model as a RESTful web service. All of the examples we have shown could be extended to invoke this web service to make predictions, using the fields from the tuple as input. Of course, keep in mind this adds extra latency to the processing (on account of the time added due to the network hop added).
Summary
In this chapter we dug deeper into how consumers from Event Hubs can be implemented that process events in a tuple-at-a-time fashion. We introduced the way consumer groups define applications that collectively process events from all partitions in the Event Hub. Then we looked at implementing processing applications in Apache Storm using both Java- and C#-based topologies. Finally, we looked at how we can host a consumer application in Azure Web Jobs and implement a consumer application using C# by leveraging the infrastructure provided by the EventProcessorHost API.
In the next chapter, we will look at the options for building real-time processing applications that take a micro-batch approach.
Get Mastering Azure Analytics, 1st Edition now with the O’Reilly learning platform.
O’Reilly members experience books, live events, courses curated by job role, and more from O’Reilly and nearly 200 top publishers.

