We have a parametric spiral curve that ascends along the different axes which is described in the following points:
- We have spiral curve along the z axis, as shown in the following code:
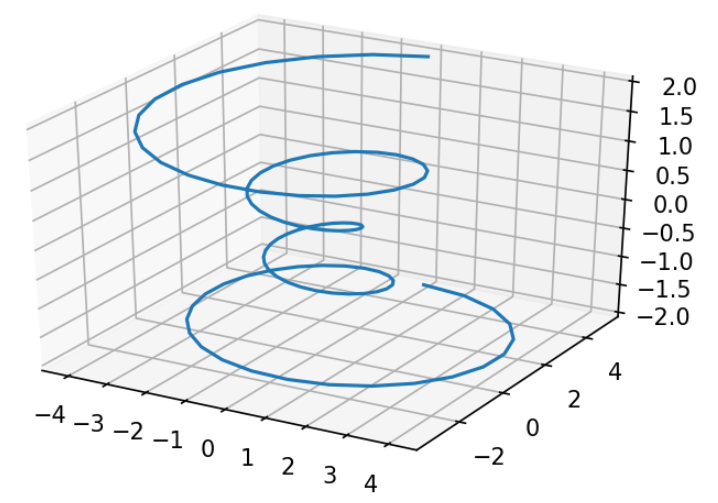
# Line plotfig = plt.figure()ax = fig.add_subplot(111, projection='3d')theta = np.linspace(-4 * np.pi, 4 * np.pi, 100)z = np.linspace(-2, 2, 100)r = z**2 + 1x = r * np.sin(theta)y = r * np.cos(theta)ax.plot(x,y,z)
Hence, here we see our spiral in the 3D plot:
- If we take a look at the view_init method, we have two keyword arguments: elevation, which is given by elev, and azimuth, which is given by azim. These are measured ...

