We also have another option for plotting vectors, and that is by using the streamplot as shown in the following points:
- The stream plot will actually follow stream lines, so they will generate smooth curves that go along the lines. An example of this is shown in the following code:
# Stream plotplt.streamplot(x, y, np.gradient(phi)[1], np.gradient(phi)[0])
Following is the output of the preceding code:
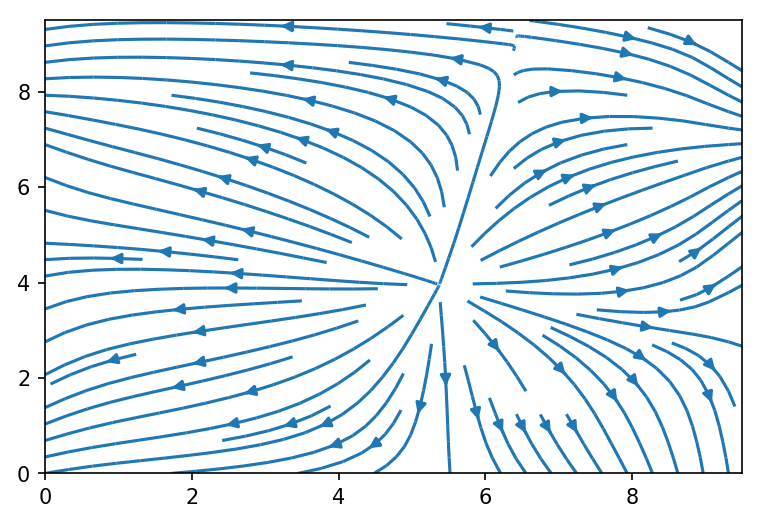
In the stream plot, we can specify a density argument that tells us how many of these lines per unit area we get. We can see that a density of 1 gives you more or less what we had before.
- When we double the density with ...

