Now, we can choose a color map from Matplotlib's selection of color maps by passing the cmap='inferno' color map:
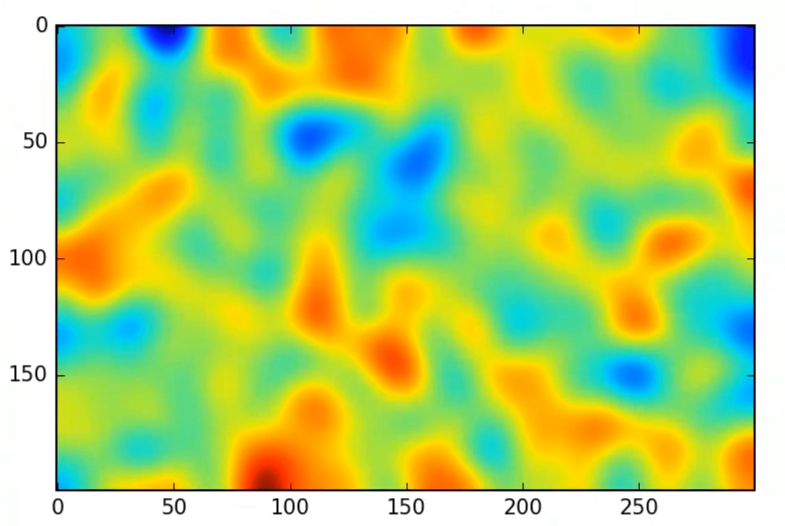
from scipy.ndimage.filters import gaussian_filterplt.imshow(gaussian_filter(np.random.normal(size=(200,300)), sigma=10))
The following displays the image using the inferno color map:
We can see the differences in the value between dark cool colors and white hot colors. The perceptually uniform color maps are good at conveying both metric and form. There are color maps that you might want to choose for different kinds of purposes.
For example, the seismic color map, which is one of the diverging color maps, is very ...

