One issue that we have to deal with in datasets for machine learning is how to handle missing values in the training set.
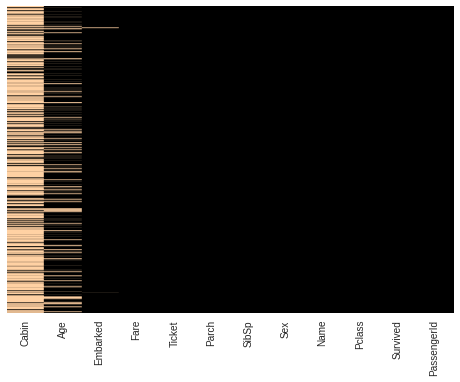
Let's visually identify where we have missing values in our feature set.
For that, we can make use of an equivalent of the missmap function in R, written by Tom Augspurger. The next screenshot shows how much data is missing for the various features in an intuitively appealing manner:

For more information and the code used to generate this data, see the following: http://tomaugspurger.github.io/blog/2014/02/22/Visualizing%20Missing%20Data/.
We can also calculate how much data is missing for each of ...

