Presenting an analysis
After performing the analysis, you would need to present some observations. The most commonly used medium for doing this is through Microsoft PowerPoint presentations. The result of your analysis could be a construct in the form of a chart or table. When presenting these constructs, there is certain information that should be added to your slides. This is one of the most common templates used:
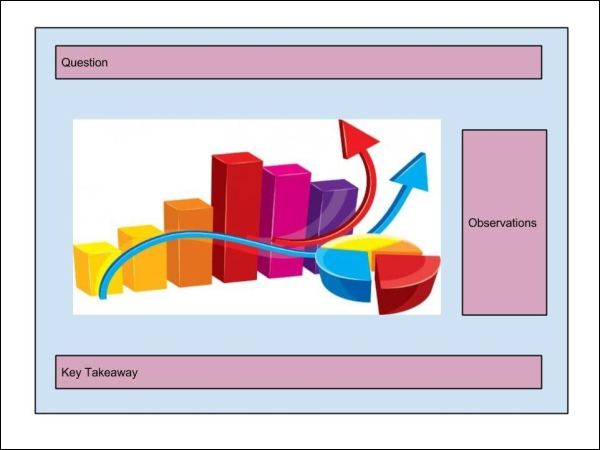
Here are the different sections of the preceding image:
- Question: The topmost part of the template should describe the problem statement that the particular analysis is trying to address.
- Observation: Here, the observations from the construct ...
Get Mastering Python for Data Science now with the O’Reilly learning platform.
O’Reilly members experience books, live events, courses curated by job role, and more from O’Reilly and nearly 200 top publishers.

