Styling your plots
The style package within the matplotlib library makes it easier to change the style of the plots that are being plotted. It is very easy to change to the famous ggplot style of the R language or use the Nate Silver's website http://fivethirtyeight.com/ for fivethirtyeight style. The following example shows the plotting of a simple line chart with the ggplot style:
>>> plt.style.use('ggplot')
>>> plt.plot([1, 2, 3, 4], [1, 4, 9, 16])
>>> plt.show()
After the preceding code is executed we'll get the following output:
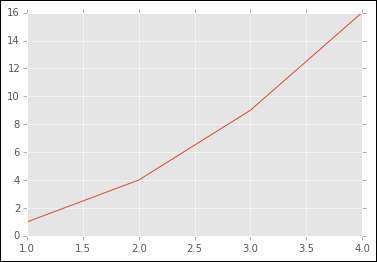
In the preceding code, plt.style.use() is used to set the style of the plot. It is a global set, so after it is executed, ...
Get Mastering Python for Data Science now with the O’Reilly learning platform.
O’Reilly members experience books, live events, courses curated by job role, and more from O’Reilly and nearly 200 top publishers.

