Chapter 10
Three-Dimensional Plots
Three-dimensional (3-D) plots can be a useful way to present data that consists of more than two variables. MATLAB provides various options for displaying three-dimensional data. They include line and wire, surface, mesh plots, and many others. The plots can also be formatted to have a specific appearance and special effects. Many of the three-dimensional plotting features are described in this chapter. Additional information can be found in the Help Window under Plotting and Data Visualization.
In many ways this chapter is a continuation of Chapter 5, where two-dimensional plots were introduced. The 3-D plots are presented in a separate chapter because not all MATLAB users use them. In addition, new users of MATLAB will probably find it easier to practice 2-D plotting first and learn the material in Chapters 6–9 before attempting 3-D plotting. It is assumed throughout the rest of this chapter that the reader is familiar with 2-D plotting.
10.1 LINE PLOTS
A three-dimensional line plot is a line that is obtained by connecting points in three-dimensional space. A basic 3-D plot ‘is created with the plot3 command, which is very similar to the plot command and has the form:
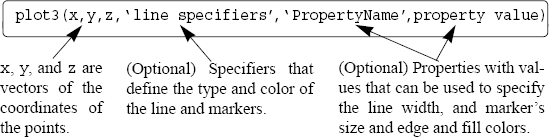
• The three vectors with the coordinates of the data points must have the same number of elements.
• The line specifiers, properties, and property values are the same as ...
Get MATLAB: An Introduction with Applications 5th Edition now with the O’Reilly learning platform.
O’Reilly members experience books, live events, courses curated by job role, and more from O’Reilly and nearly 200 top publishers.

