March 2014
Beginner to intermediate
222 pages
4h 7m
English
When displaying a curve, we implicitly assume that one point follows another—our data is the time series. Of course, this does not always have to be the case. One point of the data can be independent from the other. A simple way to represent such kind of data is to simply show the points without linking them.
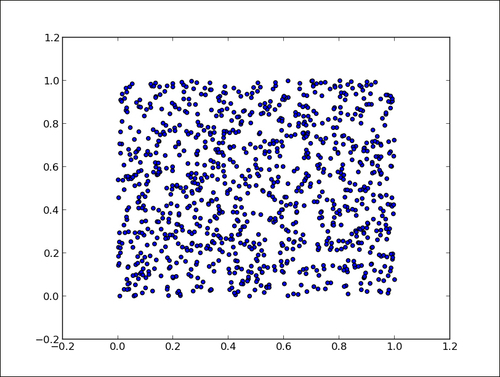
The following script displays 1024 points whose coordinates are drawn randomly from the [0,1] interval:
import numpy as np
import matplotlib.pyplot as plt

data = np.random.rand(1024, 2)

plt.scatter(data[:,0], data[:,1])
plt.show()
The preceding script will produce the following graph:
The function ...
Read now
Unlock full access


