March 2014
Beginner to intermediate
222 pages
4h 7m
English
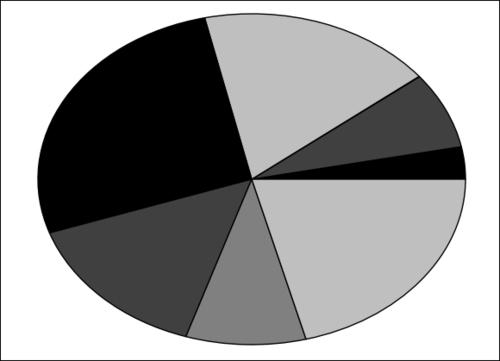
Like bar charts, pie charts are also used in contexts where the color scheme might matter a lot. Pie chart coloring works mostly like in bar charts. In this recipe, we are going to see how to color pie charts with our own colors.
The function pyplot.pie() accepts a list of colors as an optional parameter, as shown in the following script:
import numpy as np
import matplotlib.pyplot as plt

values = np.random.rand(8)
color_set = ('.00', '.25', '.50', '.75')

plt.pie(values, colors = color_set)
plt.show()
The preceding script will produce the following pie chart:
Pie charts accept a list of ...
Read now
Unlock full access


