The Chart Wizard
Excel's Chart Wizard walks you through the creation of a chart. It uses illustrated dialogs to prompt you for information. In each step of the Chart Wizard, you get to see what your chart looks like. At any point, you can go back and make changes to selections. When you're finished, your chart appears. You can then use a variety of chart formatting commands and buttons to change the look of your chart.
To use the Chart Wizard
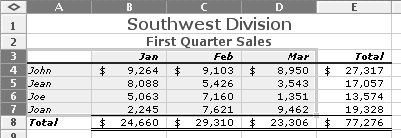
1. | Select the data you want to include in the chart (Figure 3).
Figure 3. Select the data you want to chart.
|
2. | Choose Insert > Chart (Figure 4) or click the Chart Wizard button on the Standard toolbar. |
Get Microsoft Excel X for Mac OS X: Visual QuickStart Guide now with the O’Reilly learning platform.
O’Reilly members experience books, live events, courses curated by job role, and more from O’Reilly and nearly 200 top publishers.

