Finding Trends in Your Data

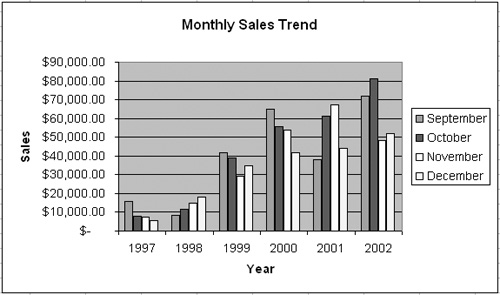
You can use the data in Excel workbooks to discover how your business has performed in the past, but you can also have Excel make its best guess as to future sales if the current trend continues. As an example, consider the following graph for The Garden Company.

This graph shows the September to December sales totals for the years 1997 through 2002. The total for each month has grown from 1997 to 2002, but the growth hasn’t been uniform, so guessing how much sales would increasce if the overall trend continued would require ...
Get Microsoft® Office Excel® 2003 Step by Step now with the O’Reilly learning platform.
O’Reilly members experience books, live events, courses curated by job role, and more from O’Reilly and nearly 200 top publishers.

