8. Creating Charts
Charts
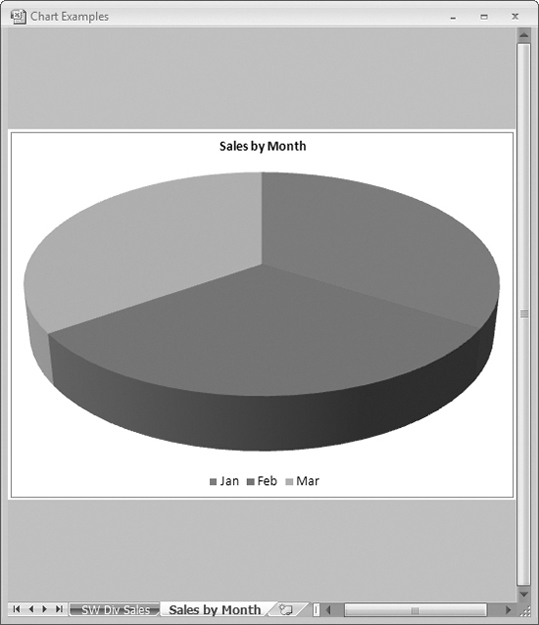
A chart is a graphic representation of data. A chart can be embedded in a worksheet (Figure 1) or can be a chart sheet of its own (Figure 2).
Figure 1. Here’s a 3-D stacked column chart embedded in a worksheet file.
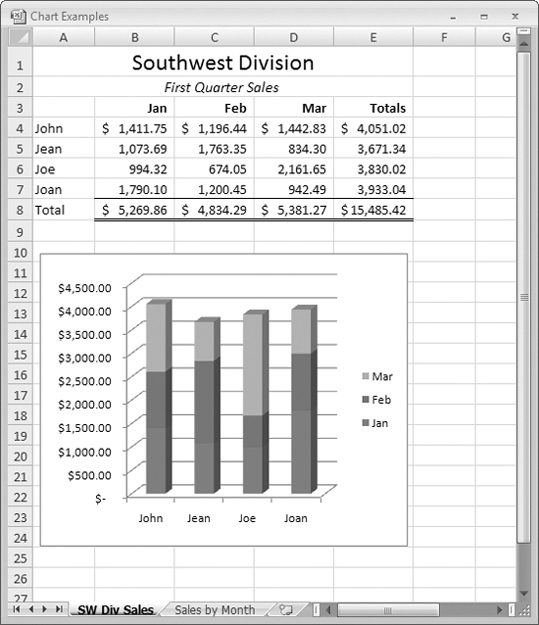
Figure 2. Here’s a 3-D pie chart on a chart sheet of its own.
With Microsoft Excel, you can create many different types of charts. The 3-D stacked column chart and 3-D pie chart shown here (Figures 1 and 2) are only two examples. Since each type of chart has at least one variation and you can customize any ...
Get Microsoft Office Excel 2007 for Windows: Visual QuickStart Guide now with the O’Reilly learning platform.
O’Reilly members experience books, live events, courses curated by job role, and more from O’Reilly and nearly 200 top publishers.

