The Pulse Chart custom visual, developed by Microsoft, also supports animated playback, but adds rich support for storytelling via customized popup text boxes and controls for automatically pausing an animation at particular data points.
- Create a table in the source database with the following columns: Event Date, Event Title, and Event Description:
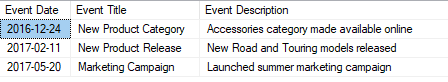
Event table with annotations to support data storytelling
- Insert event detail rows into this table and create a view for access by the Power BI data model.
- Expose this new view as an M query in Power BI Desktop (EventAnnotations).
- Use an outer join M function from ...

