Most dashboard tiles are created in the Power BI service by pinning a visual, image, or shape from a report to a new or existing dashboard in the same app workspace. However, dashboard tiles can also be created by adding a tile directly from the dashboard itself and by pinning from an Excel Workbook or an SSRS report.
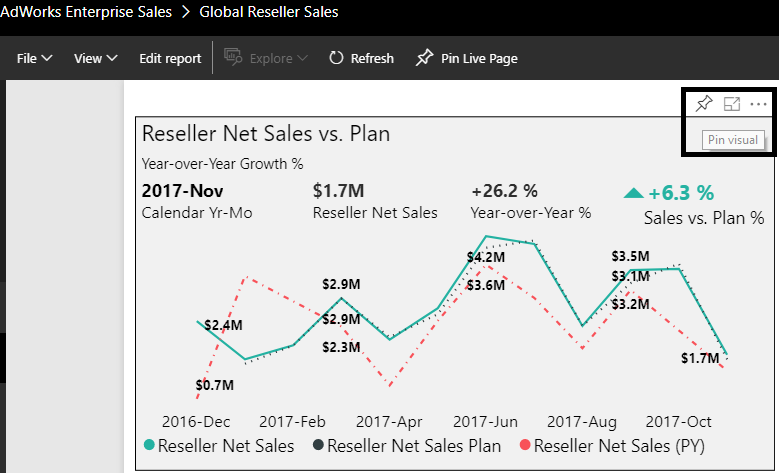
With a report open in the Power BI service, hovering over the top-right corner of a visual exposes the Pin visual icon, per the following image from the Global Reseller Sales report:

Report visuals can be pinned to dashboards from both the Reading view and the Editing view. The ...

