VII.2.3. The Windows System Monitor
The Windows Task Manager is a great place to start when trying to understand the current performance profile of your system. However, when it's time to get more serious about gaining a deeper understanding of your performance metrics, it's hard to beat the Windows System Monitor — a sophisticated tool that tracks massive data amounts, including SQL Server-specific information. What's also especially useful is that it works for your local machine as well as remote machines. This means that you can monitor multiple servers at one time from within one user interface.
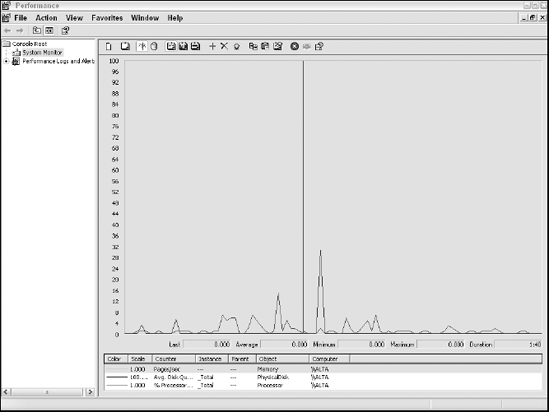
Depending how your server is configured, there are several ways to launch this utility. One fail-safe approach is to open the Control Panel, and drill into the Administrative Tools folder. When you're in this folder, double-click the Performance shortcut. Figure 2-3 shows a rudimentary example of this utility.
Figure VII.2-3. The Microsoft Management Console System Monitor.

One of the most compelling capabilities for this monitor is its ability to incorporate reams of information from various classes of system metrics into a holistic, easy to understand user experience. A list of all available objects and their related statistics would fill many pages; therefore, here's a look at several of the most relevant objects from the perspective of a SQL Server system administrator:
Processor: ...
Get Microsoft® SQL Server™ 2008 All-In-One Desk Reference For Dummies® now with the O’Reilly learning platform.
O’Reilly members experience books, live events, courses curated by job role, and more from O’Reilly and nearly 200 top publishers.

