Appendix 1
Value-Area Calculation
The value area represents the area of greatest trade facilitation and acceptance of value in the day timeframe and is signified by the price region where 70 percent of the day's volume occurred. It can be calculated using either actual price/volume numbers or approximated by substituting TPOs when volume is not available.
Volume Value-Area Calculation
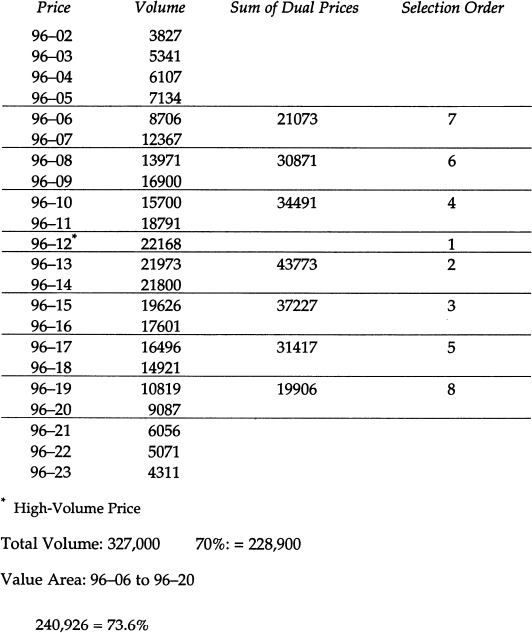
Figure A1.1 illustrates how to calculate the volume value area. First, identify the price at which the greatest volume occurred. Then, sum the volumes occurring at the two prices directly above the high-volume price and compare it to the total volume of the two prices below the high-volume price. The dual price total with the highest volume becomes part of the value area. This process continues until 70 percent of the volume is reached.
Figure A1.1 Volume Value-Area Calculation

In Figure A1.1, the greatest volume (22,168) occurred at 96–12. The total volume for the two prices above 96–12 is 34,491 (Sum of Dual Prices) and the two price total below is 43,773. Since the lower total is greater, it is added to the high-volume price as part of the value area. The same process is repeated, comparing the next two lower prices (96–15 and 96–16), to 96–10 and 96–11 again. The lower total is higher and is, therefore, the next addition to the developing value area. This process is repeated until the volume reaches ...

