Chapter 5. Can you predict the customers who are likely to leave? 103
Neural network — prediction
Neural prediction produces similar results to RBF, which is the quantile view
based on the prediction result. For a better understanding of neural prediction
output, you can build the tree model using, for example, the top and bottom 10%
of customers based on predicted value to identify the characteristics of churners.
This is covered in detail in Chapter 6, “How to discover the true value of your
customers” on page 109.
5.6.2 Performance comparison
Now, using decision tree, RBF and neural network prediction, you’ve identified
what kind of characteristics are involved in a customer’s churn action. We can get
the insights based on the results from three techniques for a retention campaign.
Accuracy of the model, in other words, prediction capability is an important factor
for the actual deployment phase. Do you have confidence that your model
predicts the customers who are really going to leave? You should compare the
performance of each model and choose the best one. You can compare the lift
value by the gains chart or run the test campaign based on the customers list
generated by each model.
By gains chart
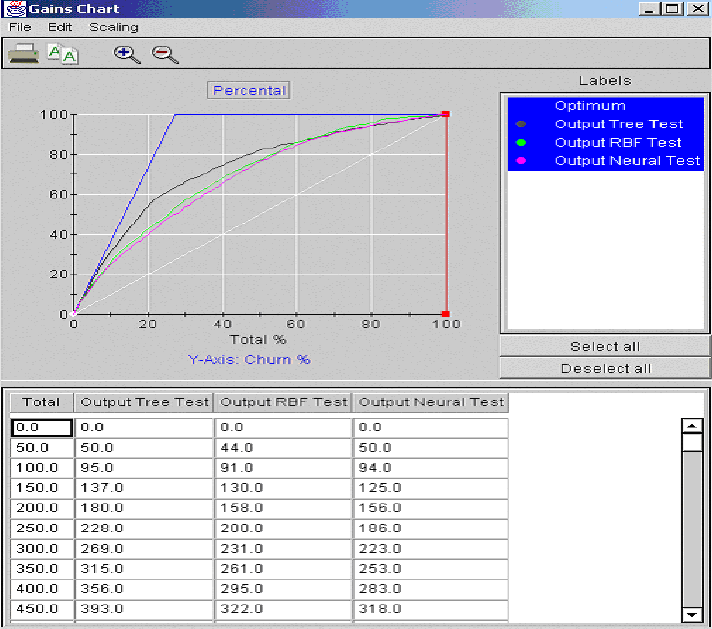
This is the gains chart to evaluate models.
Figure 5-12 implies the following:
If you take 10% of customers randomly as your target customer for your
campaign (which is the base line in white), then approximately you’ll have
reached 10% of future churners.
If you take 10% of customer based on tree model as your target (which is the
second black line from the top) then approximately you’ll have 30% of future
churners.
For the RBF and neural prediction model, you’ll have 25% of future churners.


