CHAPTER 11Guided Analytics: Making It Relevant
So, What?
Imagine you are a newly hired analyst for the Edison Motors (EM) car company. Your first week on the job, your manager tasks you with producing a Vehicle Safety and Quality Dashboard to track two of the company's KPIs—Safety and Quality. Directing you to the customer complaints database, your manager tells you the executives want to know how many customer complaints are received, what are they about, where are they from, how they compare to our competition, whether any were hazardous, and so on. She also tells you that it would be nice if the dashboard could help spot patterns and trends and provide early warning alerts to growing quality or safety issues.
You get the dataset, explore the data, clean it up, and within a week you have a dashboard that you think is pretty good (see Figure 11.1).
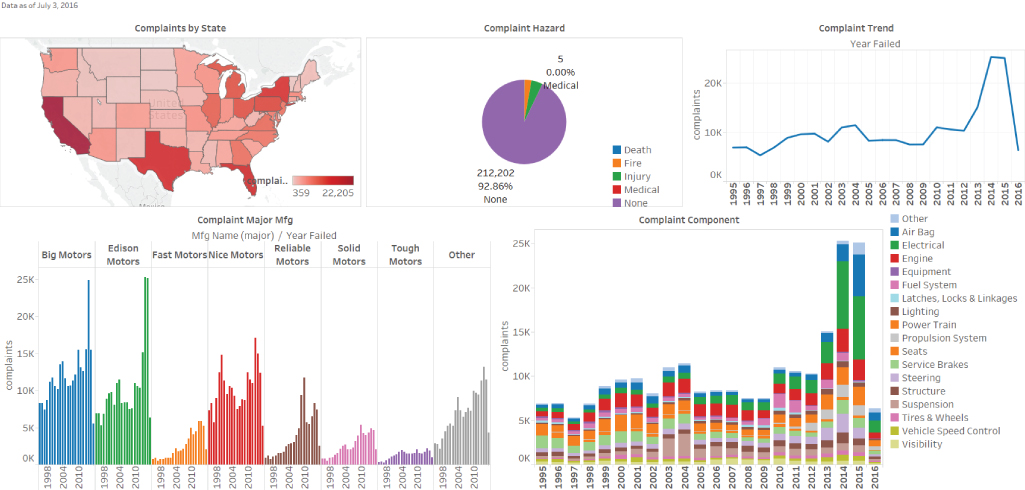
Figure 11.1 Edison Motors Customer Complaints Dashboard
You show it to your manager, whose response is underwhelming to say the least.
Get Monetizing Your Data now with the O’Reilly learning platform.
O’Reilly members experience books, live events, courses curated by job role, and more from O’Reilly and nearly 200 top publishers.

