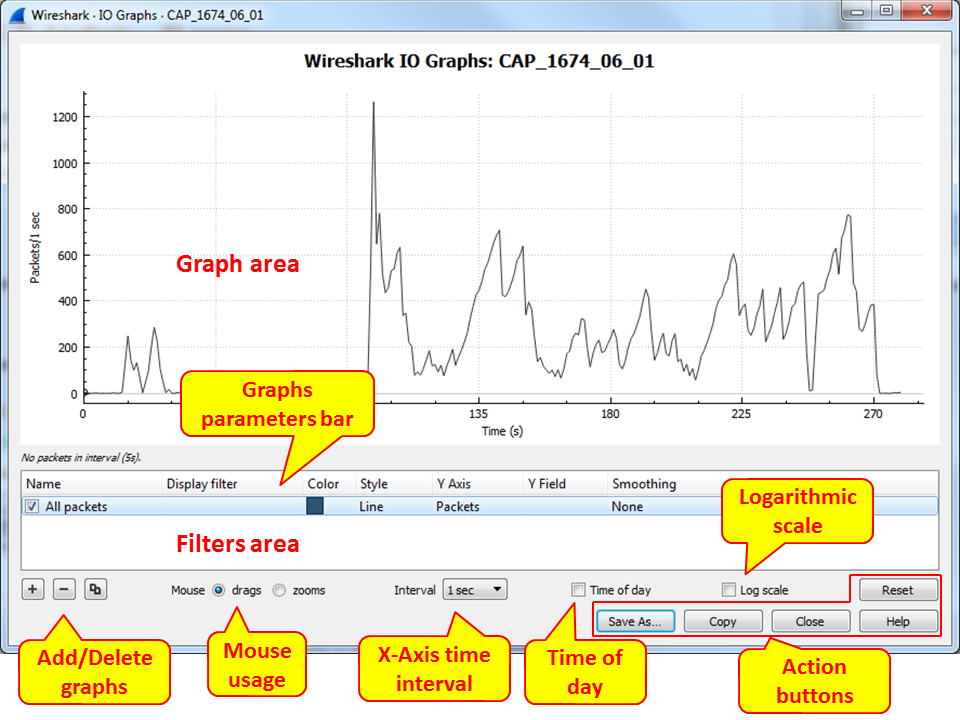
Run the I/O graph, and you will get the following window:

On the upper part of the window, you see the graph area. On the lower-left side, you have the filters area, which enables you to configure display filters that will enable specific graphs. The default, as you can see in the preceding screenshot, is packets per second on the y axis and time in seconds on the x axis.
You can configure the following parameters for the window's display:
- The +/- and copy buttons in the lower-left corner of the window are used to add/delete and copy graphs.
- Use the mouse usage checkboxes to drag or zoom. You can drag a graph across the window ...

