APPENDIX
Summary Case Study—Supply Chain Management Example
This Appendix combines several of the techniques covered throughout the book. The case study utilizes features like simple formulas, absolute addressing, sensitivity analysis, the Solver add-in, scroll bars, advanced chart ideas, and more.
A very important part of the Appendix is about presentation. The combination of charts, pictures and animation will show you how to take an analytic problem and make it exciting and convince your audience.
THE PROBLEM
This case is a supply-chain problem where a Chinese supplier wants to set up a single distribution center to deliver goods to a number of regional supply warehouses. The supplier’s challenge is to find a single location to set up his site to minimize the total annual shipping cost.
The data for the case is presented in Figure A.1: You can find the data on the sheet named Plant Location China of this appendix’s workbook (use the Appendix A file).
FIGURE A.1 Data for the Supply Chain Problem
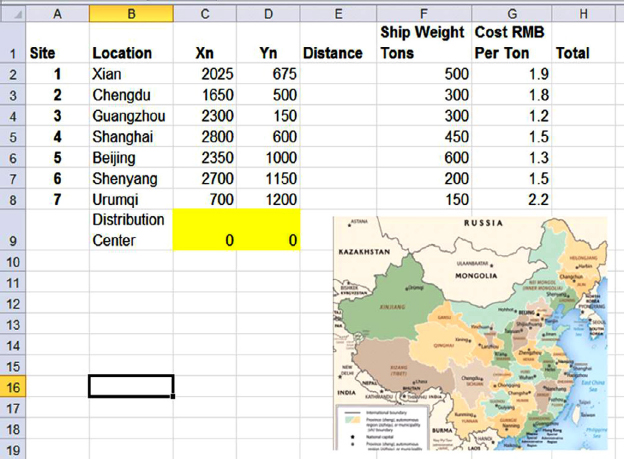
There are seven locations to supply from this distribution center. If you take, for example, the first location on the list, Xian, it is located approximately 2,025 km east from the lower left side of the map (X-axis) and 675 km north. See cells C2 and D2. If you take Beijing, it is located 2,350 km east and 1,000 km north from the same point. See Figure A.2.
FIGURE A.2 Beijing on the ...
Get Next Generation Excel: Modeling In Excel For Analysts And MBAs (For MS Windows And Mac OS), 2nd Edition now with the O’Reilly learning platform.
O’Reilly members experience books, live events, courses curated by job role, and more from O’Reilly and nearly 200 top publishers.

