Chapter 27
Data Mining Using Pivot Tables
This chapter is about more advanced PivotTable techniques. After you master the basics of the previous chapter, you can explore many more of the PivotTable features in this chapter.
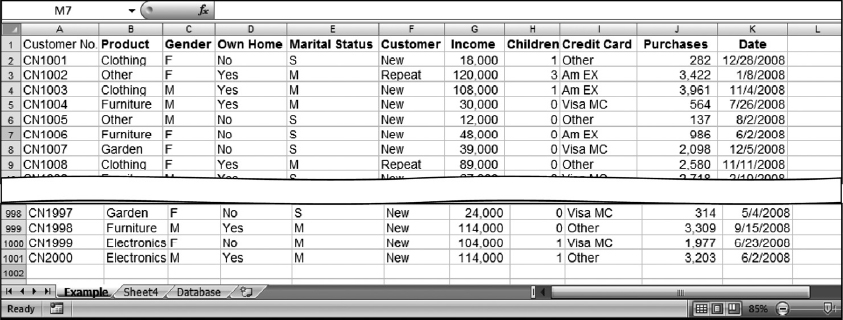
On the Example sheet of the Chapter 27 Excel file, you will see a partial database of 1,000 customers’ purchases. Using this sales report, you can try and detect patterns in the data—mining as it is called—using Excel’s PivotTable report. In doing so, you will master many of the possibilities offered by the PivotTable. Figure 27.1 shows a small section of the database. (The sample data has 1,000 sales records.)
FIGURE 27.1 A Database with 1,000 Customers

As an analyst, you might want to explore relationships between the different variables; for example, between the customers’ attributes and purchases. It may help your marketing and salespeople to identify the type of customers they want to target to increase sales—particularly if you have limited resources, and marketing wants to reach only part of the customer base.
The goal is to try to detect patterns. You can also check the relationship between the number of children and purchases. Try something else: the married/single attribute and purchases. Should marketing target customers with more children? Should they target married or single customers? You can try and find out these relationships using a PivotTable. ...
Get Next Generation Excel: Modeling In Excel For Analysts And MBAs (For MS Windows And Mac OS), 2nd Edition now with the O’Reilly learning platform.
O’Reilly members experience books, live events, courses curated by job role, and more from O’Reilly and nearly 200 top publishers.

