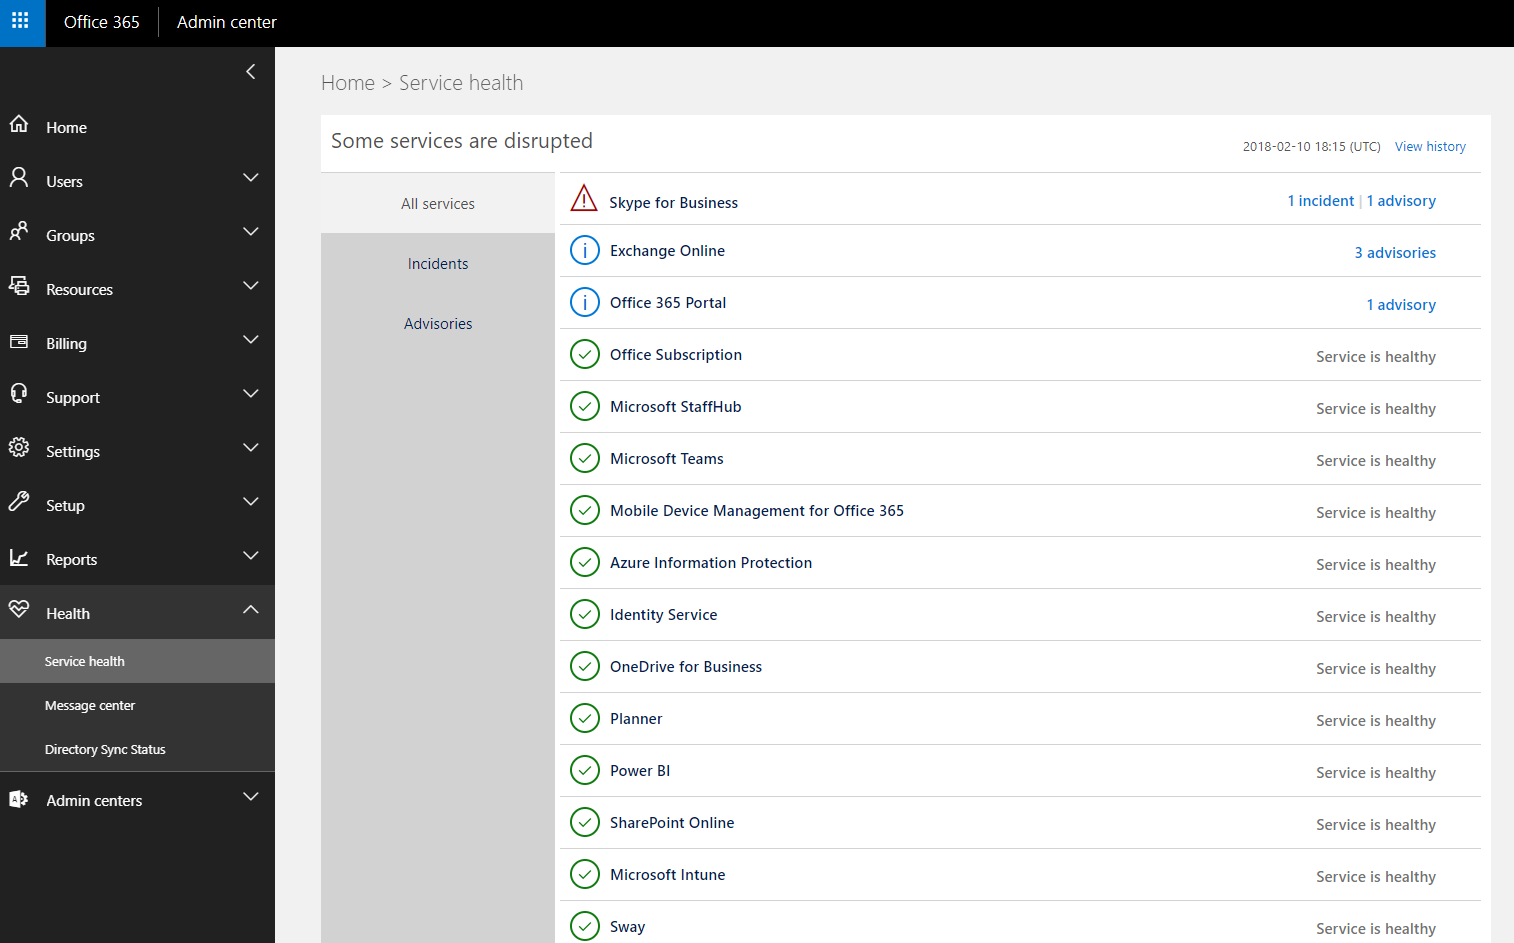
In the Health section of the admin portal, you have the Service health dashboard, which monitors how the services are doing and the present status of each one, as shown in the following screenshot:
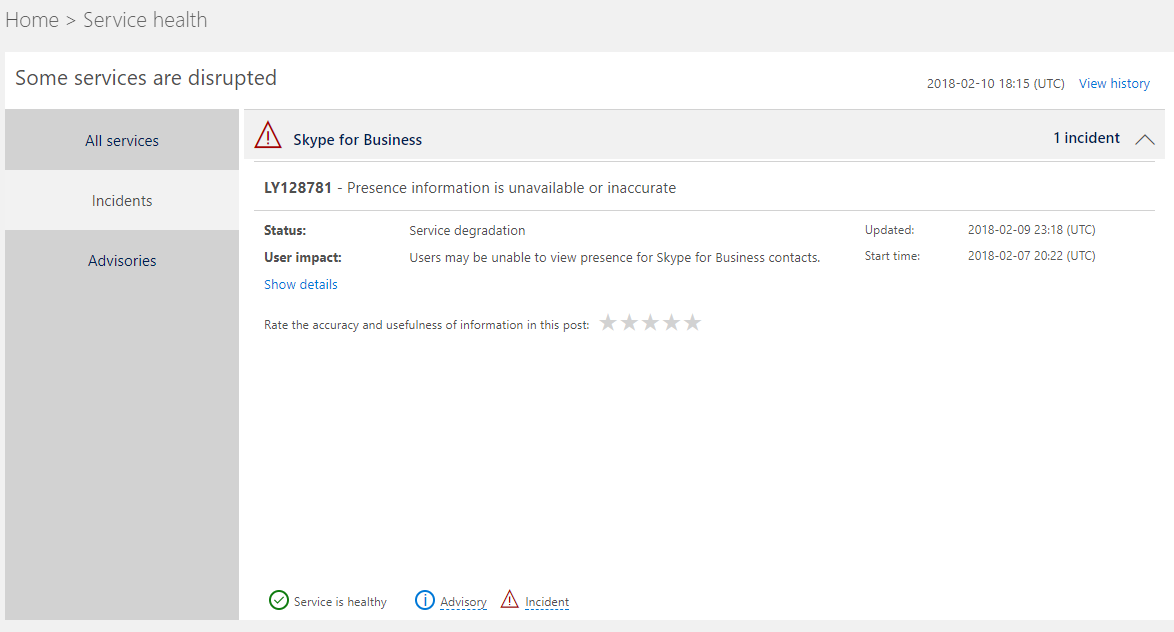
For example, this incident has the following status:
When you click on the Show details link, you can see the detailed information for this incident, as shown in the following screenshot:
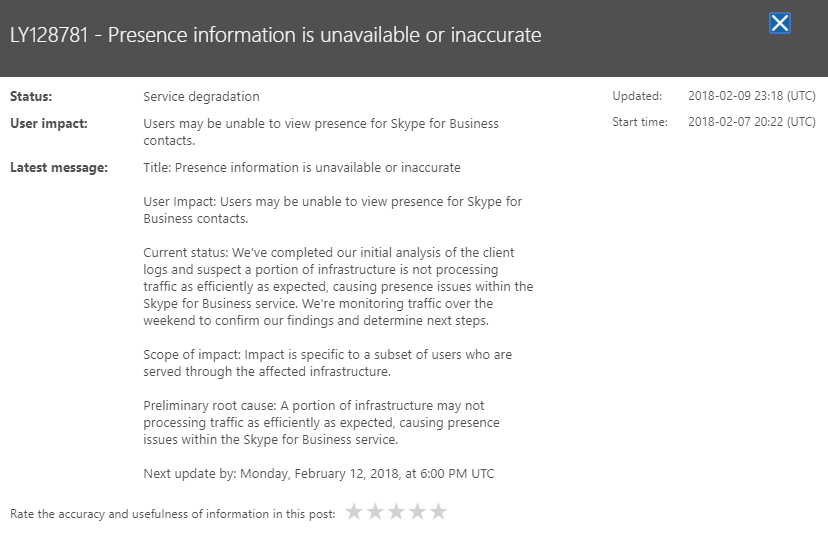
You can see more details under the Message history ...

