While the Grafana interface is easy to navigate, some elements of it may seem non-intuitive, and many of the icon command descriptions are hidden within tooltips. So, just in case, we've provided instructions to click through each element of the interface and produce a graph within a custom dashboard.
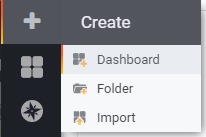
We begin by clicking New dashboard to start the process. Since this is a new installation of Grafana, we even get a special link to do this that's on the main page. Normally, we have to use the left sidebar menu to do this, as shown in the following screenshot:
In the future, when we add more dashboards, we would want to use ...

