Chapter 9. Unsupervised Learning
Take a look at Figure 9-1, and tell me what you see.
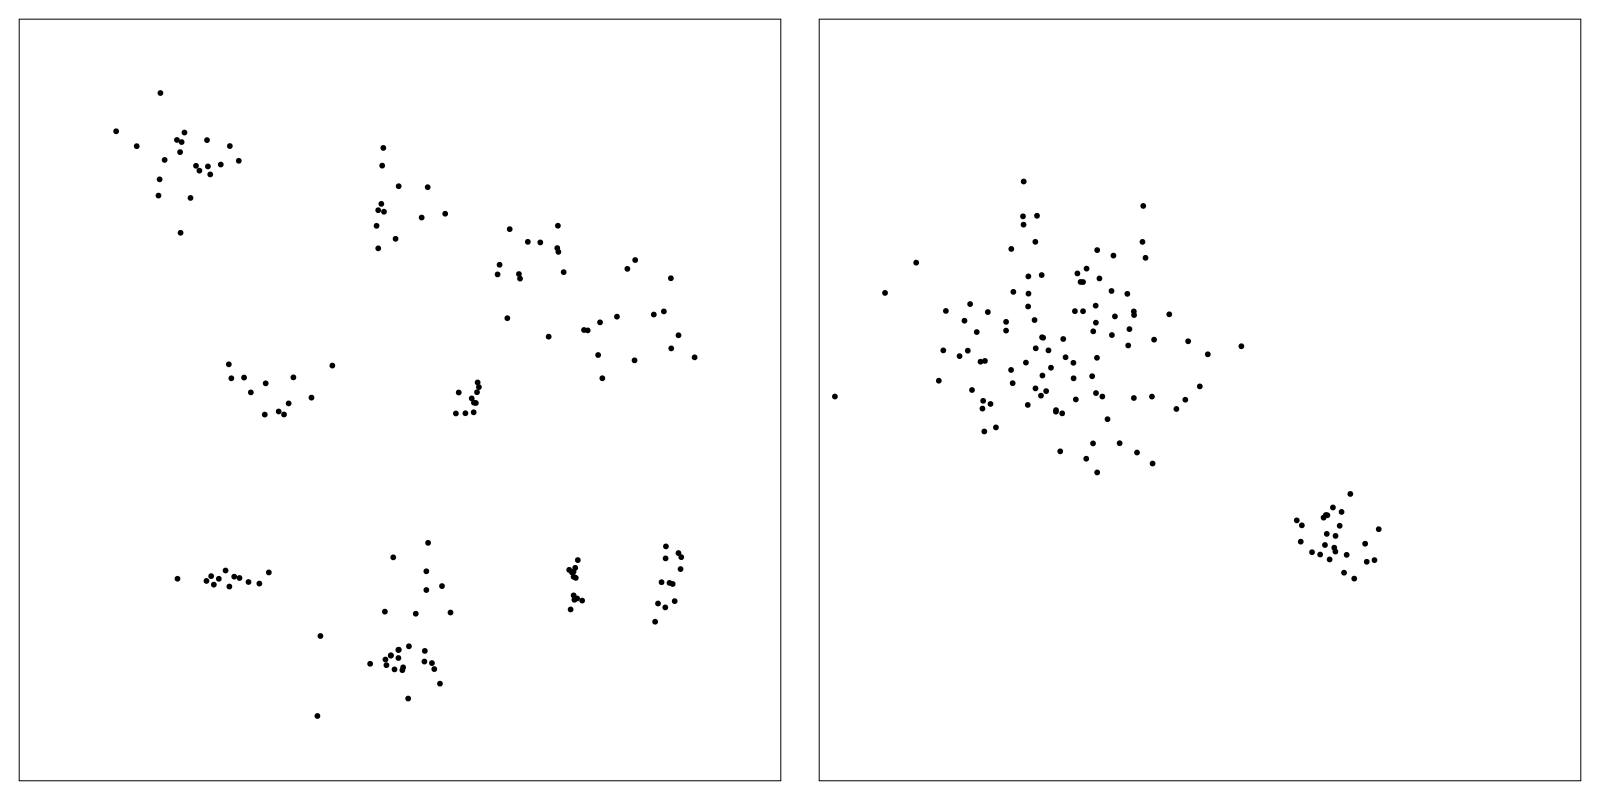
Figure 9-1. Two scatterplots
It doesn’t matter what the x- and y-axes are in those two plots; imagine each plot represents a scientific domain. For the chart on the left you likely identified about 10 different concepts, so that domain is likely to have about 10 specialist words; some are blurring into each other, so maybe 9, maybe 11 or 12? But the domain on the right has two concepts, and is only going to have two specialist words. Or they might be describing weather conditions over a year. The chart on the left might be describing a place with lots of distinct weather patterns, so the weather becomes a talking point, and lots of weather phrases enter the vocabulary (“Is it chucking it down outside?” “No, just a light drizzle”). The chart on the right might represent the climate of Southern California, where only two weather phrases are needed (“lovely and sunny,” and “slightly cloudy”).
The point is, you didn’t need to know the subject or the “correct answer” to be able to do something useful with the data you were given, and this is a core strength of human intelligence. In machine learning, it is called unsupervised learning, and this chapter will look at some of the functionality H2O has for it.
This automatic organization of the data can be thought as a form of data compression. If you ...
Get Practical Machine Learning with H2O now with the O’Reilly learning platform.
O’Reilly members experience books, live events, courses curated by job role, and more from O’Reilly and nearly 200 top publishers.

