Chapter 25. How to Make Small Multiples
Small multiples are a group of charts or graphs that share the same axes and scales, which allows the user to compare trends across dimensions in a single view. They have been praised for their ability to provide a great deal of context, reducing the need for end users to ask the dreaded, “So what?” The term “small multiples” was popularized by Edward Tufte, who puts it best in his book, Envisioning Information:
“At the heart of quantitative reasoning is a single question: Compared to what?”
While smaller series of small multiples can work well on an executive summary dashboard, I typically like to use them as a second layer in an analysis. My executive level view, or “first layer,” may provide higher-level information about a particular measure, such as the overall sales trend and progress toward goals. This is a “descriptive” view of the data answering the question, “What is happening with sales?” From here, I may provide an option to view sales across different dimensions and sub-categories as a series of small multiples in a second layer of the dashboard (often located away from the first view). While small multiples is still a “descriptive” view, it helps answer the question, “Compared to what?”
In this chapter, we will be re-creating the following small multiples view:
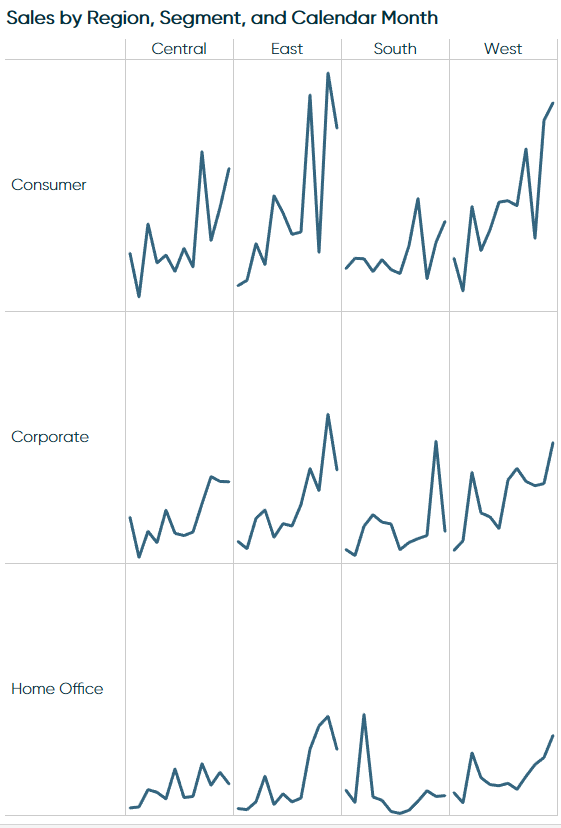
How to Make Small Multiples in Tableau
Small multiples can come ...
Get Practical Tableau now with the O’Reilly learning platform.
O’Reilly members experience books, live events, courses curated by job role, and more from O’Reilly and nearly 200 top publishers.

