Chapter 27. How to Make a Stacked Area Chart
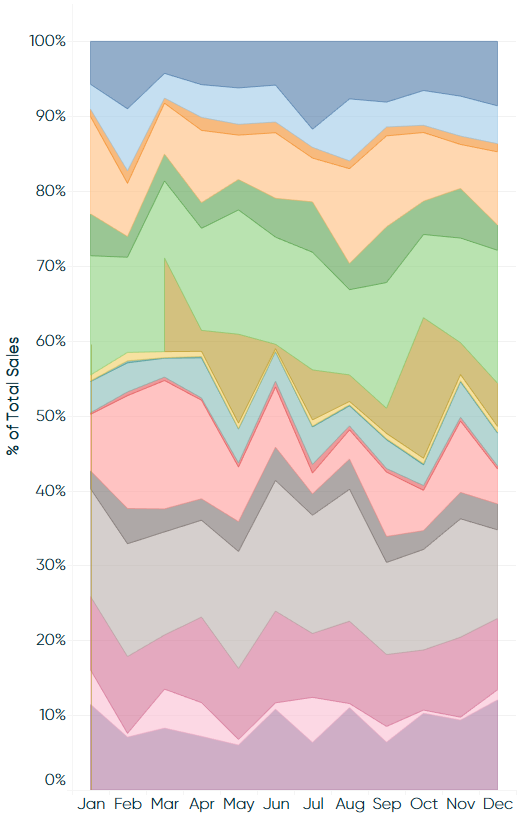
A stacked area chart “stacks” trends on top of each other to illustrate how a part-to-whole distribution changes over time. Combined with a table calculation that computes the percent of total for each dimension member in the visualization, stacked area charts are an effective way to evaluate distributions. In this chapter, we will be re-creating this visualization:
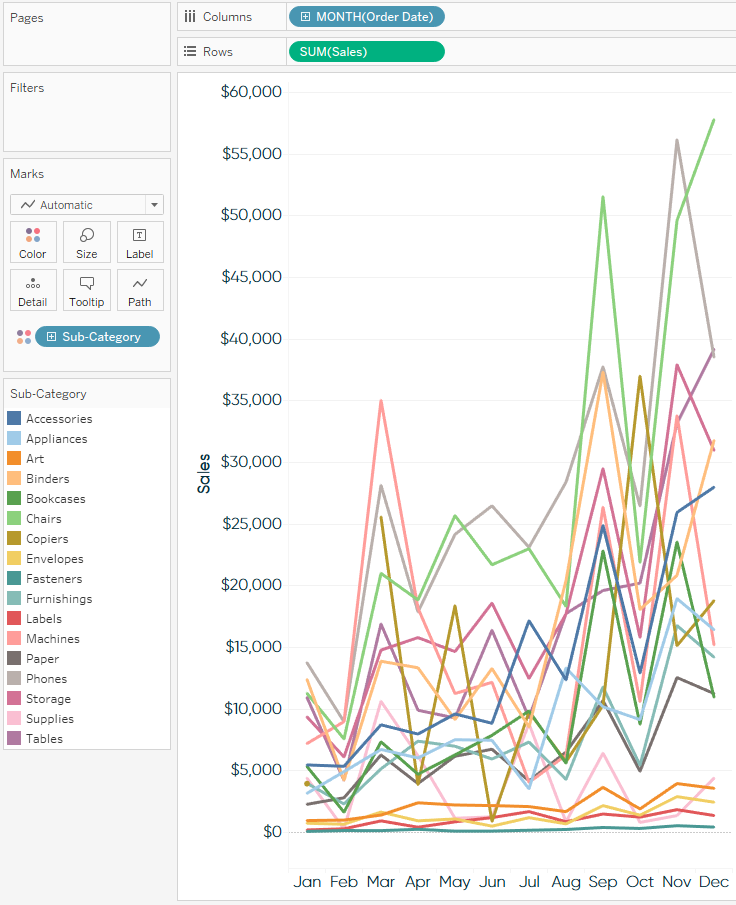
To create a stacked area chart, I will start with this line graph showing Sales by Sub-Category by discrete Month of Order Date in the Sample – Superstore dataset:
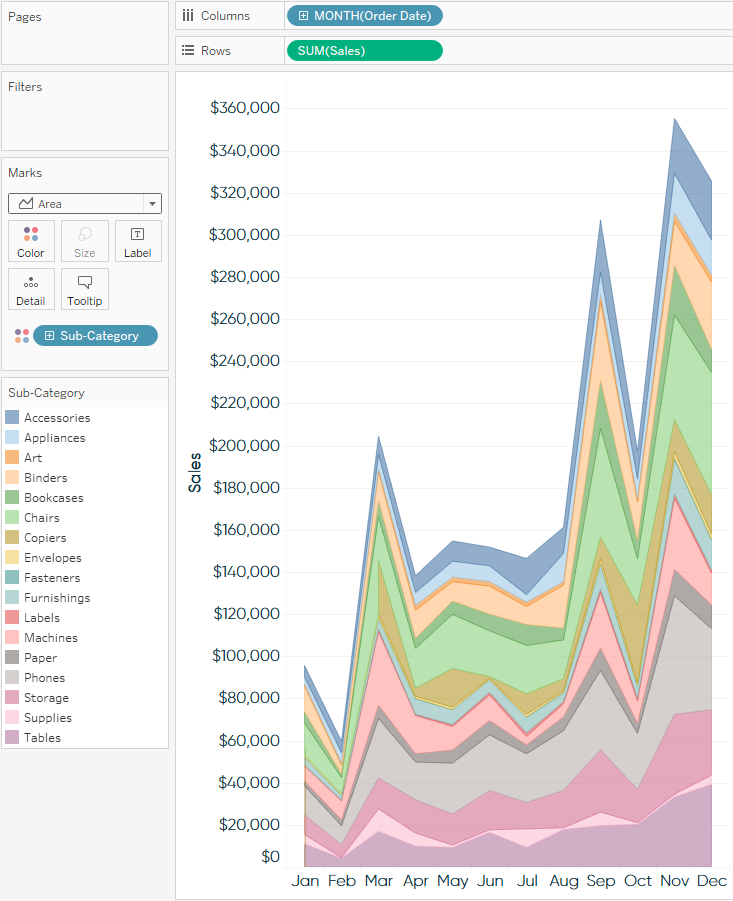
To create a stacked area chart in Tableau, simply change the mark type from Automatic, which is currently set to Line, to Area:
As stacked area charts are one of the foundational Show Me options and are extremely easy to create in Tableau, this chapter will focus more on the best applications of this chart type and a trick for using them most effectively.
As you can see in the previous image, when the mark type was changed from Line to Area, the values for each of the dimension members for Sub-Category were stacked on top of each other. This provided a new insight to us that was not available when the mark ...
Get Practical Tableau now with the O’Reilly learning platform.
O’Reilly members experience books, live events, courses curated by job role, and more from O’Reilly and nearly 200 top publishers.

