Chapter 34. How to Map Anything in Tableau
The out-of-the-box Tableau symbol and filled maps are some of the most powerful visualization types available in the software. As illustrated in Chapter 98, maps provide a means of decoding hundreds of latitude/longitude pairs almost instantly—all with a single image. Not only that, Tableau does a lot of the heavy lifting for us by providing the geographic coordinates of locations all over the world—this way we get to enjoy making maps instead of looking up longitudes and latitudes. Maps became even better in Tableau 9 with lasso and radial selections.
But wait—there’s more! You can create custom maps in Tableau for just about anything. This tutorial will walk you through how to map any background image in Tableau.
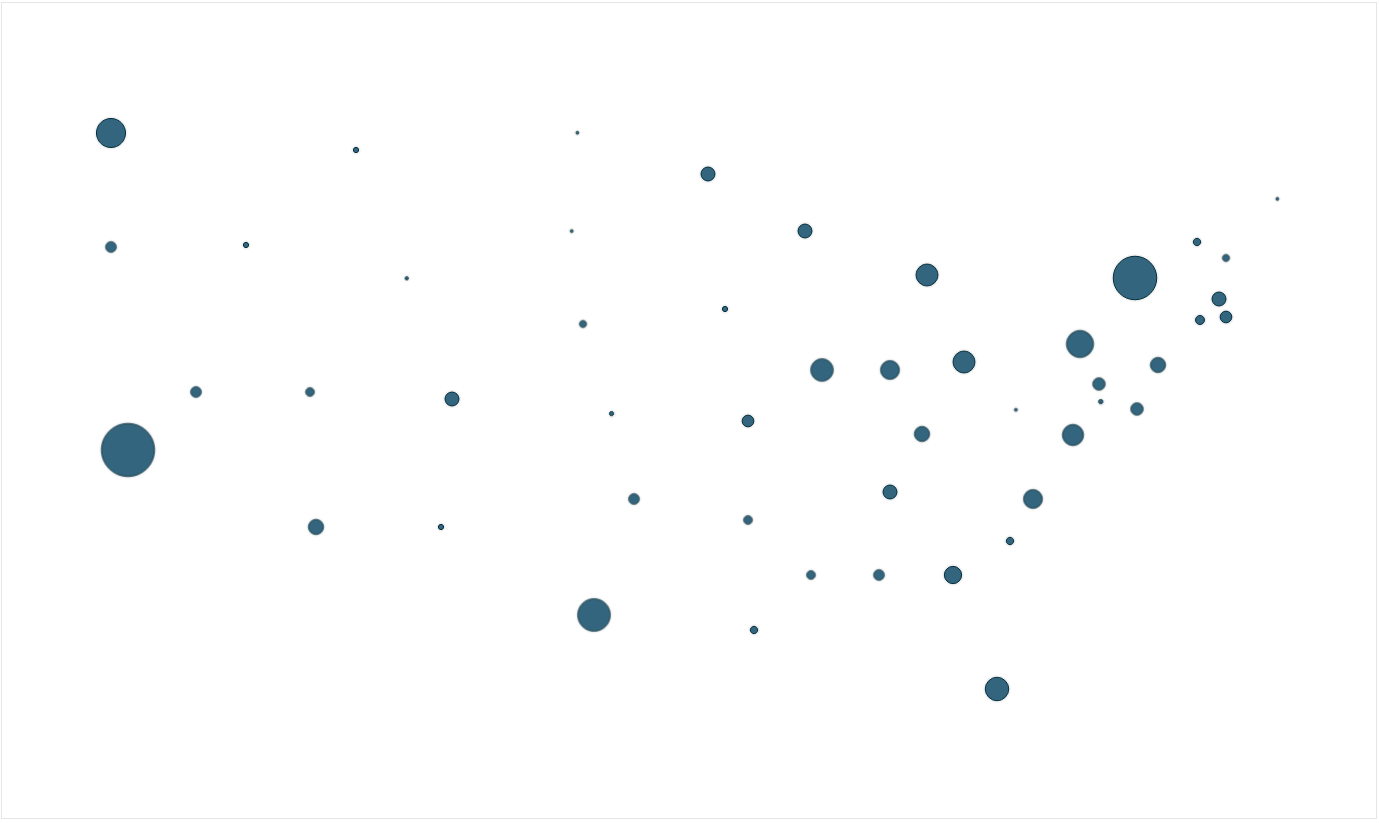
Maps in Tableau can be thought of as scatter plots with a background image. Tableau will plot a point at each combination of the latitude on the y-axis and longitude on the x-axis. To help illustrate the scatter plot concept, take a look at the following two images. First, the latitude and longitude plotted with no background image:
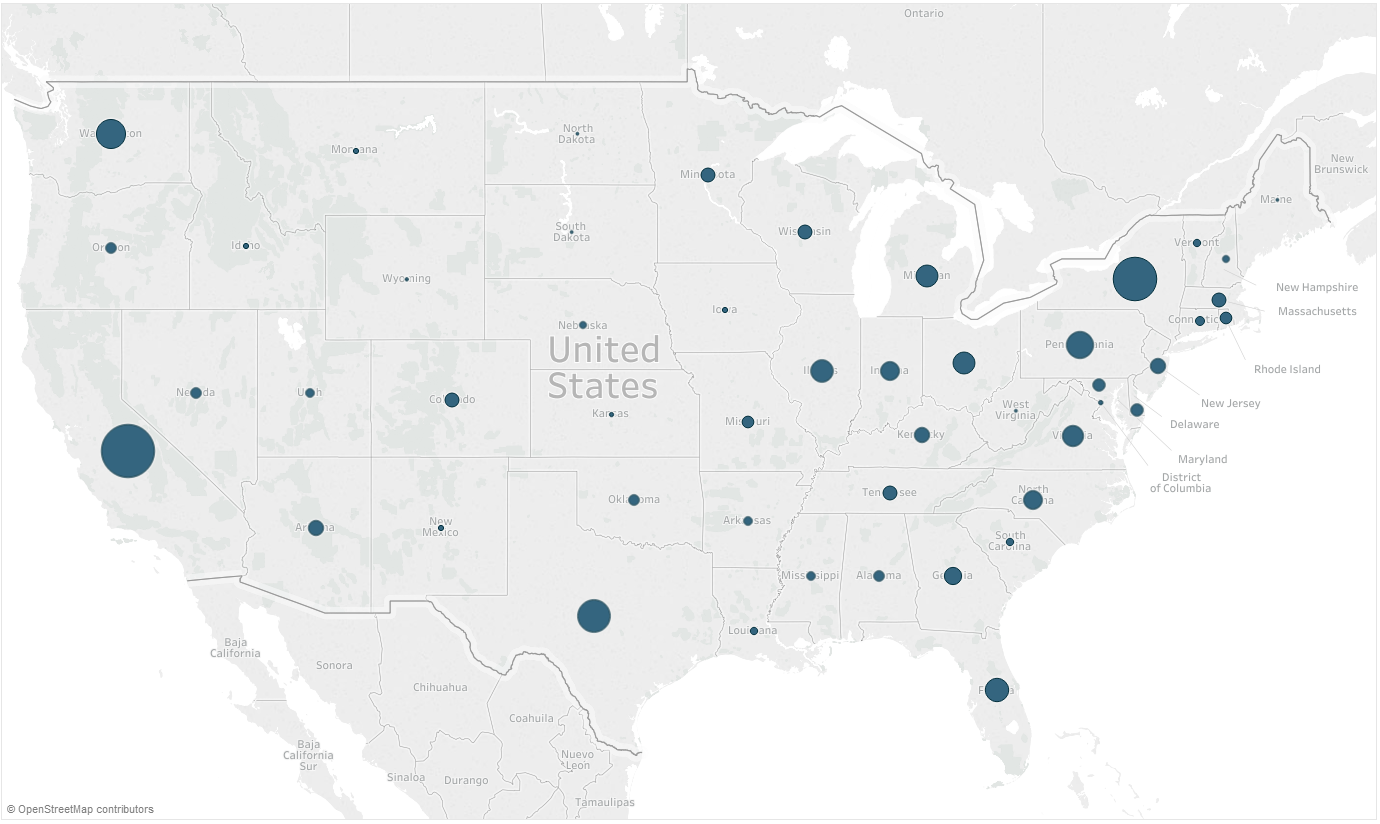
And here, the same data points plotted with a background image of the United States:
Due to the way maps function in Tableau, as long as you know the coordinates of a point on the vertical y-axis ...
Get Practical Tableau now with the O’Reilly learning platform.
O’Reilly members experience books, live events, courses curated by job role, and more from O’Reilly and nearly 200 top publishers.

