Chapter 47. How to Create Icon-Based Navigation or Filters

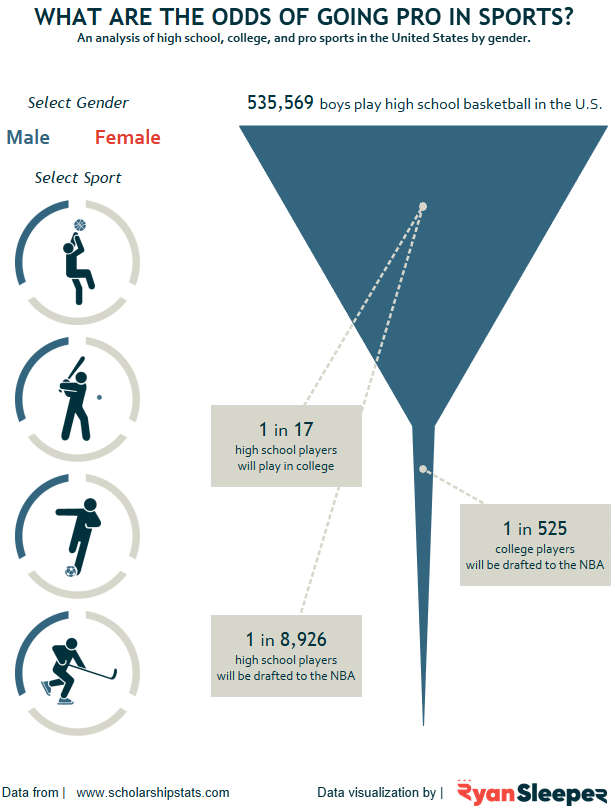
Let’s take another look at the Odds of Going Pro visualization. We discussed how to make funnel charts in Tableau using this as an example back in Chapter 40. Now I will show you how to install custom shapes and use the images to filter and navigate dashboards in Tableau. Here’s the Tableau Public dashboard:

prta 4701

How to Make Icon-Based Navigation/Filters in Tableau

As I mentioned in Chapter 40, I attribute the success of this viz to its simplicity. Not only does it use just one chart to tell the story about the odds of going pro in sports, it uses a simple, intuitive navigation that allows the end user to filter the funnel by gender and sport.

You can easily create a similar navigation by placing the icons you want to use in your Tableau Repository. Every computer with Tableau has a folder called My Tableau Repository. On a PC, it’s located at C:Users/[Your User Name]/Documents/My Tableau Repository. Among other handy Tableau files, the Shapes folder in your Tableau Repository holds custom shapes that can be used to create a custom navigation.

I recommend creating a new folder for each unique “shapes palette” that you want to create, and place the corresponding image files there. For example, the preceding viz uses a custom shapes palette I called “Odds of Going Pro” in My Tableau Repository. Here is how the folder structure ...

Get Practical Tableau now with the O’Reilly learning platform.

O’Reilly members experience books, live events, courses curated by job role, and more from O’Reilly and nearly 200 top publishers.