Chapter 48. How to Make a What-If Analysis Using Parameters
Parameters are one of the most powerful tools available in Tableau for exploring your data and providing interactivity to your end users. As discussed in Chapter 14, the best way to think of parameters is that they are user-defined values that are not tied to a specific dataset. In the simple formula 2 multiplied by X = 16, the value of X would be the parameter; in this case, equal to 8. The reason parameters are so powerful is that you or your end users can change the value of X from 8 to any number, which will change the results of a view.
In this chapter, we will use this concept to create a what-if analysis that will show us what would happen if we improved our sales from 0%–100%. Parameters come in many different forms, but for this chapter, we will be creating a parameter from integers, or whole numbers.
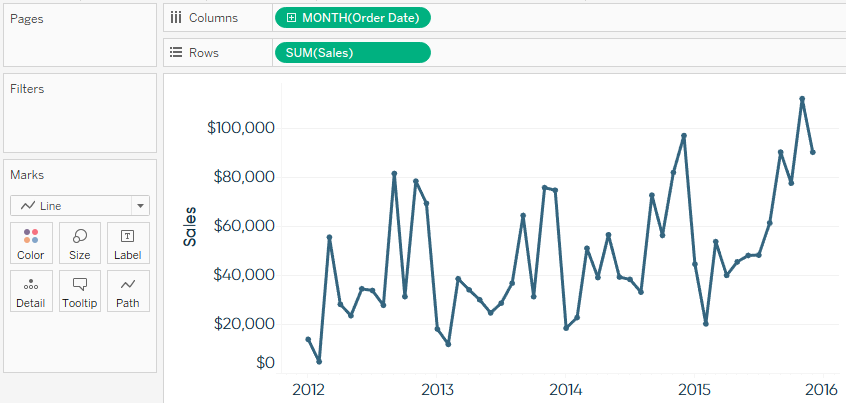
Let’s start by creating a simple line graph showing sales over time:
To create a parameter, right-click any white space in the Data pane and select Create Parameter. This is where you can choose from six different data types. We only want the ability to select nonfractional numbers, so choose Integer as the data type. There are some additional options available, including the current value (which will be the default value the first time you use the parameter), allowable values, and within “Range,” minimum value, ...
Get Practical Tableau now with the O’Reilly learning platform.
O’Reilly members experience books, live events, courses curated by job role, and more from O’Reilly and nearly 200 top publishers.

