To demonstrate group wise aggregation we will use the time series on mean daily temperature of Fisher River in Texas, United States. The time series has observations taken between 1st January 1988 and 31st December 1991. The dataset has been downloaded from http://datamarket.com and is also available in the datasets folder of this book's GitHub repo.
We start by reading and plotting the original time series as follows:
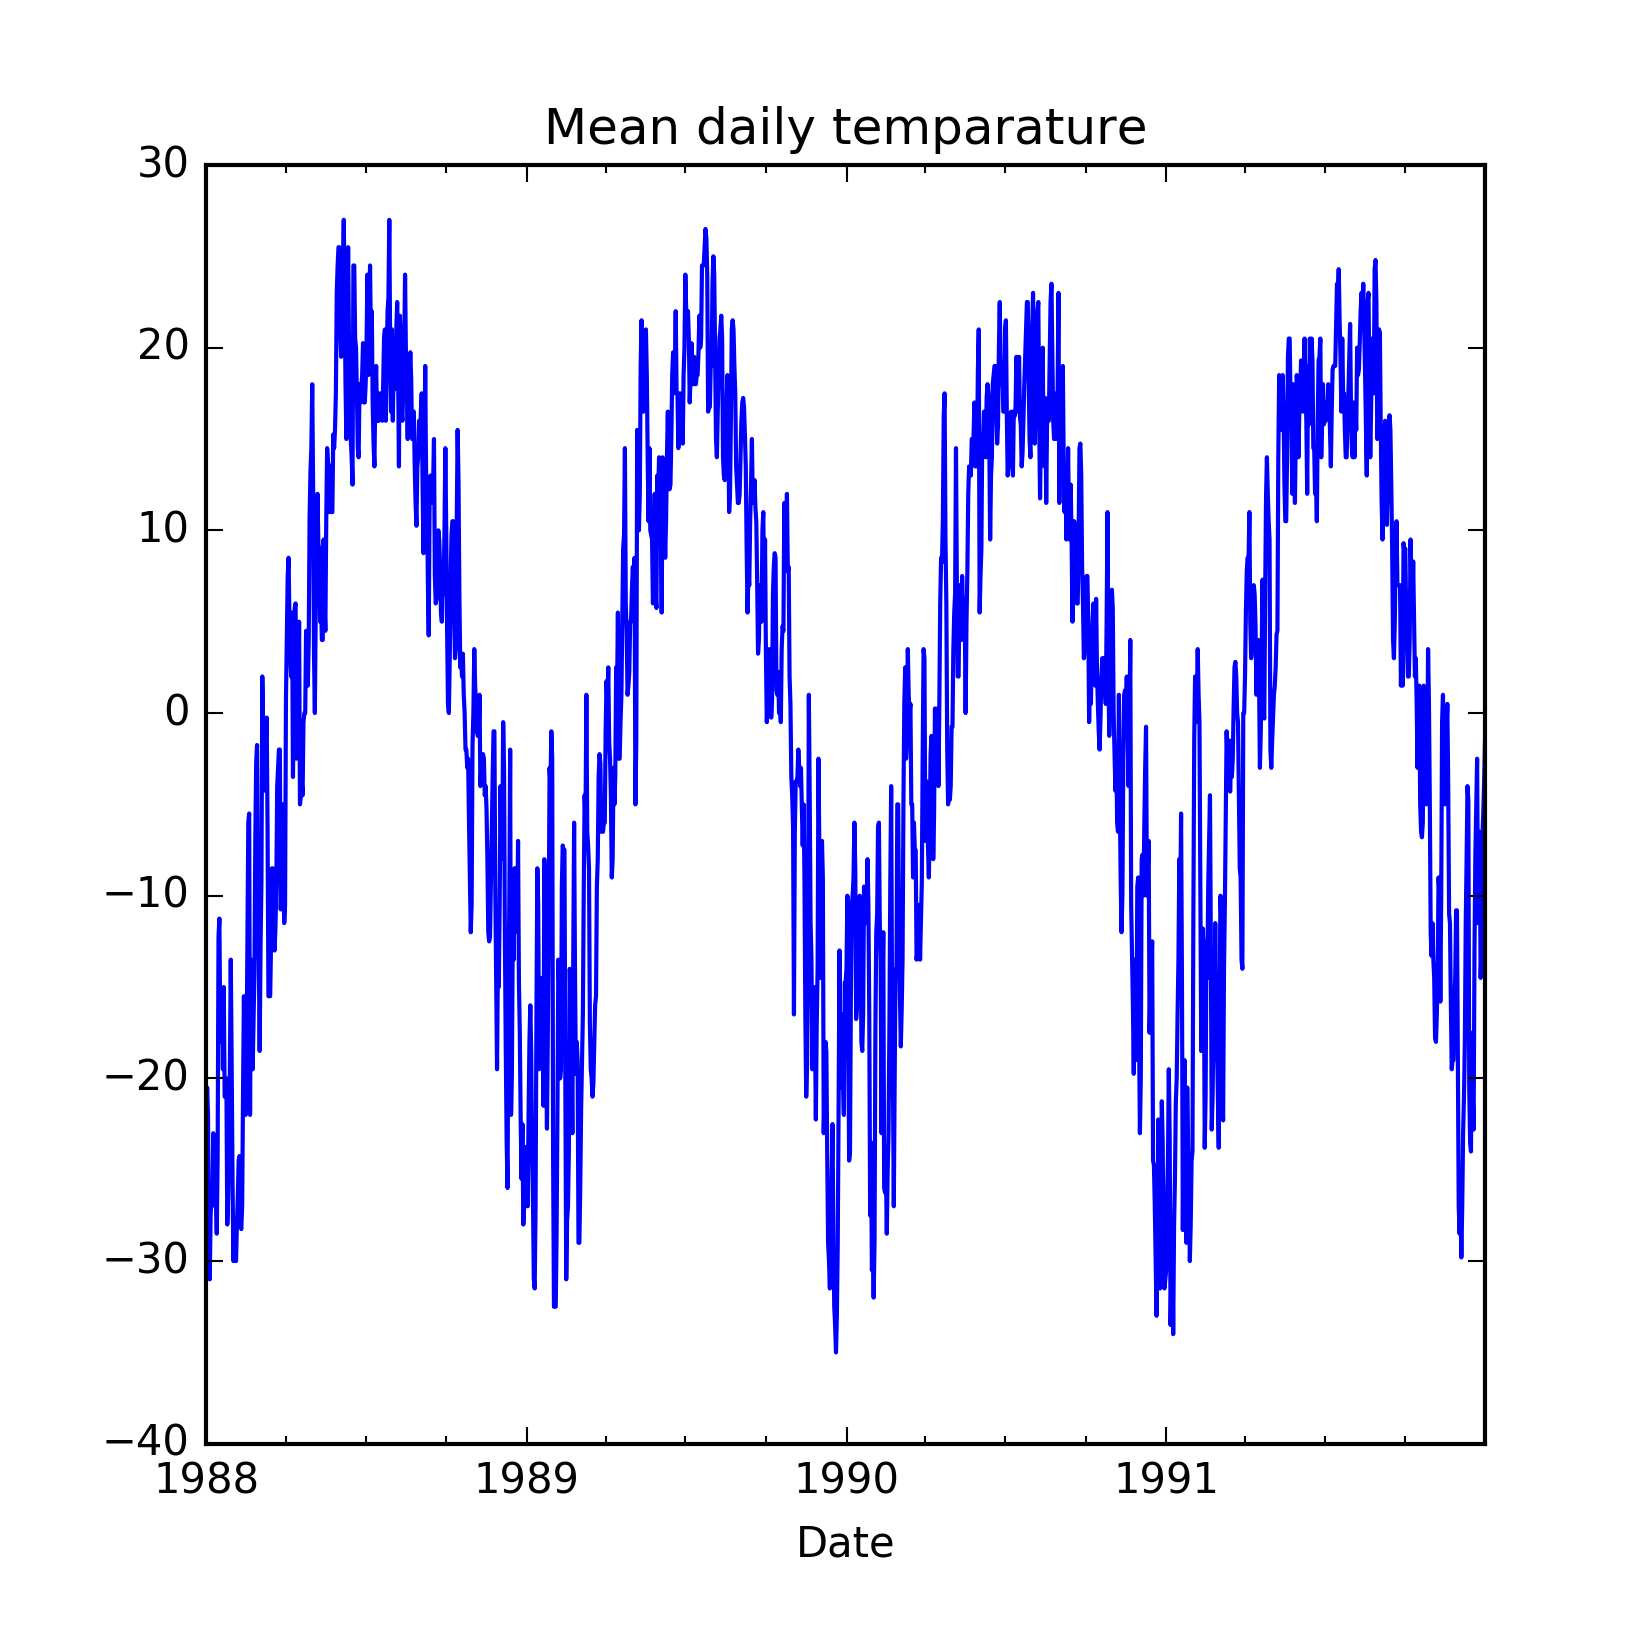
Figure 2.3: Time series of daily mean temperature of Fisher River in Texas, United States
The original time series seems to have monthly patterns that repeat every year and can be verified by calculating ...

