Model evaluation
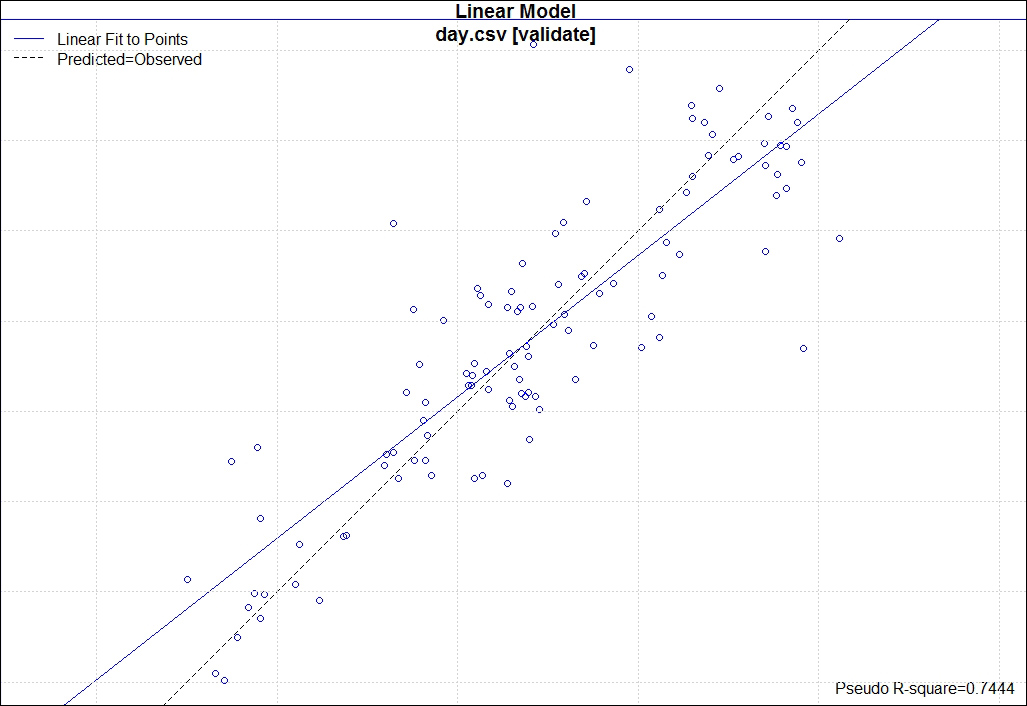
As we saw in Chapter 7, Model Evaluation, to evaluate the performance of a regression model, we can use a plot called Predicted versus Observed Plot (Pr v Ob), as shown here:

We've quickly developed a model that achieved a Pseudo R-square of 0.744. We did a small optimization in the model; we can improve the performance by working with the different variables.
After improving the model using the training dataset to build the model and the validation dataset to evaluate this performance, we need to confirm the performance of our model by creating a Predicted versus Observed Plot with the test dataset. We can do that to detect overfitting. ...
Get Predictive Analytics Using Rattle and Qlik Sense now with the O’Reilly learning platform.
O’Reilly members experience books, live events, courses curated by job role, and more from O’Reilly and nearly 200 top publishers.

