September 2023
Beginner to intermediate
368 pages
8h 30m
English
“We are surrounded by data, but starved for insights.”
—Jay Baer
Ah, this word, insight. Like data storytelling, this is another term used ad nauseum in the data field; stakeholders are always asking for more insights, and no matter how hard we try to give them more insights, we seem to keep missing the mark.
The best definition of “insight” I've found is this: “the capacity to gain a new, accurate, deep, and intuitive understanding of a person or thing.” Did you catch certain words there? Accurate, deep, intuitive, and new. Let's go back and remember what we've been presenting (up until now) during our meetings; see Figure 20.1.
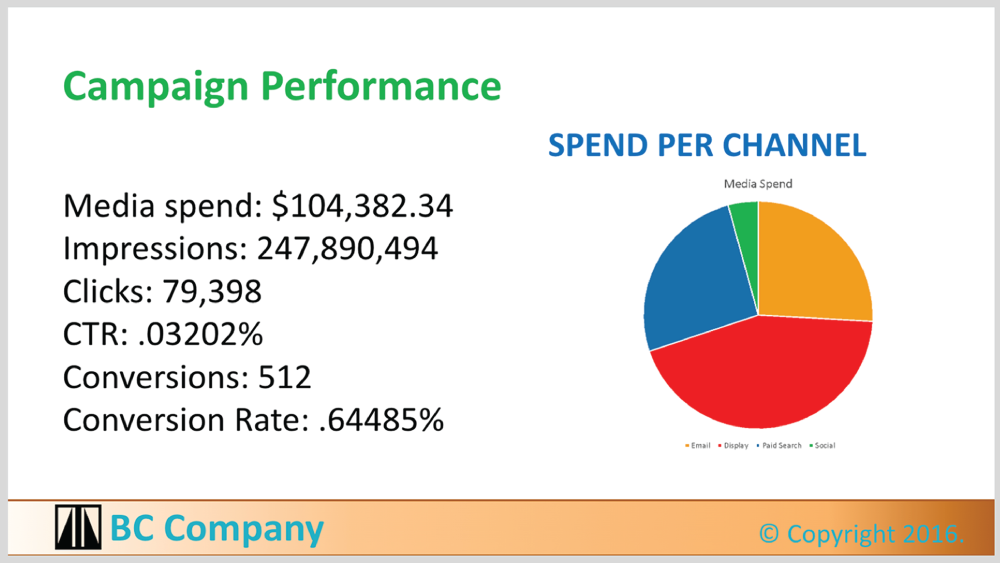
FIGURE 20.1 A not-so-shining example of a well-visualized data slide
This beauty is one of mine, and I can honestly say it did not cut the mustard. If I asked myself while synthesizing my data story, “Does this facilitate an accurate and deep, intuitive understanding,”? the answer would be a resounding nope.
Brent Dykes, my esteemed analytics contemporary and author of Effective Data Storytelling, augments this definition with the element of surprise (new), where an insight inspires an “a-ha!” moment for the audience. The idea is that if you're presenting data to an audience that they already know, you are not presenting an insight. This chapter reviews how you can infuse the eureka factor into your data story slides.
Read now
Unlock full access


 O’Reilly covers everything we've got, with content to help us build a world-class technology community, upgrade the capabilities and competencies of our teams, and improve overall team performance as well as their engagement.I wanted to learn C and C++, but it didn't click for me until I picked up an O'Reilly book. When I went on the O’Reilly platform, I was astonished to find all the books there, plus live events and sandboxes so you could play around with the technology.I’ve been on the O’Reilly platform for more than eight years. I use a couple of learning platforms, but I'm on O'Reilly more than anybody else. When you're there, you start learning. I'm never disappointed.I'm always learning. So when I got on to O'Reilly, I was like a kid in a candy store. There are playlists. There are answers. There's on-demand training. It's worth its weight in gold, in terms of what it allows me to do.