209
15
Severity Modelling: Adjusting for
IBNER and Other Factors
Having produced a frequency model in Chapters 13 and 14, we can now explore the lower
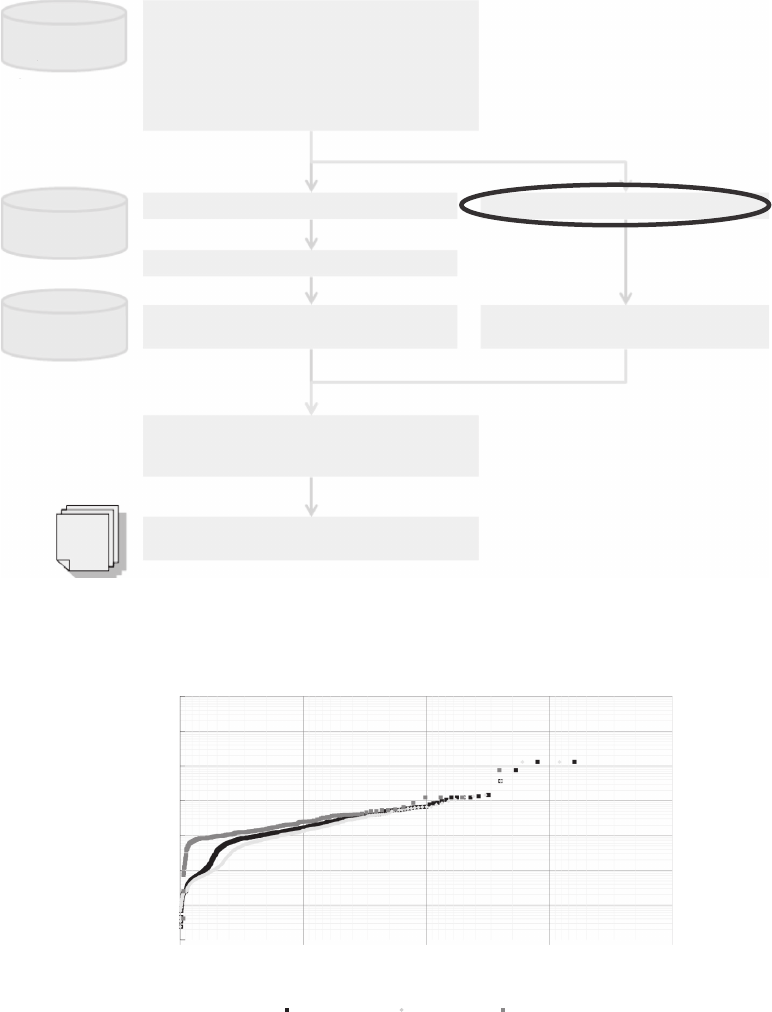
‘branch’ of the pricing process (Figure 15.1), which aims at producing a severity model
based on the past loss experience of the portfolio under investigations and possibly other
information from other relevant portfolios of risks.
15.1 Introduction
The rst problem that we need to address is that many of the losses that we may use to
estimate the overall distribution of losses (the ‘severity distribution’) are not nal settled
values but estimates, as they are composed of a paid and an outstanding component, and
the outstanding reserve is an estimate of what the remaining amount will be.
The difference between the nal settled amount and the overall estimate (paid + out-
standing) is called the ‘IBNER’ (incurred but not enough reserved – or sometimes, bizarrely,
incurred but not enough reported) amount.
Naturally, if the policy of the company is to set reserves neutrally and is competent
at that, you expect errors to average out and systematic IBNER to be zero. However, if
reserves systematically overestimate or underestimate the loss amount, then one needs to
correct for IBNER. IBNER will be positive if the reserves are underestimated, and negative
if they are overestimated.
How do we know if there is a systematic error? Ideally, we should have the complete
history of all reserve estimates and how they change in time. Large losses are typically
reviewed at regular intervals and the reserve is updated if any new fact emerges. With
small losses, this is less likely, but they will still be given a temporary amount according
to some company protocol and they will then be updated when they are settled. In both
cases, a good strategy would be to compare the estimated amounts with the nal one.
Even if we do not have the reserving history, we may still have for each claim the amount
reserved and the information on whether it is closed or paid (either stated explicitly or
implicitly by looking at whether a percentage of the amount incurred is still outstanding).
In this case, a comparison of the severity distribution of the closed/settled claims with the
distribution of the open claims may be interesting.
We have done exactly this for our case study and have shown the results in Figure
15.2. In this gure, we are comparing the distribution of settled claims (where the deni-
tion of settled was ‘more than 95% paid’) with the distribution of the non-settled claims.
Obviously, the two distributions are, in this case, quite different, and the main difference
is that non-settled claims seem much larger than settled claims.

210 Pricing in General Insurance
Individual
loss data
Assumptions on
– Loss inflation
– Cu
rrency conversion
– …
Exposure
data
Portfolio/market
information
Data preparation
– Data checking
– Data cleansing
– Data transformation
– Claims revaluation and currency conversion
– Data summarisation
– Calculation of simple statistics
Inputs to frequency/severity analysis
Adjust historical claim counts for IBNER
Adjust for exposure/profile changes
Select severity distribution and
calibrate parameters
Select frequency distribution and
calibrate parameters
Adjust loss amounts for IBNER
Severity model
Frequency model
Estimate gross aggregate distribution
e.g. Monte Carlo simulation, Fast Fourier
transform, Panjer recursion…
Gross aggregate loss model
Ceded/retained aggregate loss model
Allocate losses between (re)insurer and
(re)insured
Cover
data
FIGURE 15.1
This gure shows how IBNER analysis ts within the pricing process.
10
100
1000
10,000
100,000
1,000,000
10,000,000
100,000,000
0.01
%
0.10%1.00%10.00%100.00%
Amount [€]
All losses Settled Non-settled
Exceedance probability
FIGURE 15.2
Each dot in this graph represents a loss. The graph is to be read as follows: for settled (light grey) losses, for
example, there are roughly 1% of losses that are above €100K. The graph shows that non-settled (medium grey)
losses are usually bigger than the settled losses, especially in the small–medium loss range. This has quite a
large effect on the mean: non-settled claims have a mean of €14K compared with €8K for settled losses.
Get Pricing in General Insurance now with the O’Reilly learning platform.
O’Reilly members experience books, live events, courses curated by job role, and more from O’Reilly and nearly 200 top publishers.

