18The Normal Distribution
In many practical applications, measurements tend to cluster around a central value, with the largest proportion of measurements occurring near this central value, and decreasing as the measurements extend at either side of this central value (Figure 18.1).
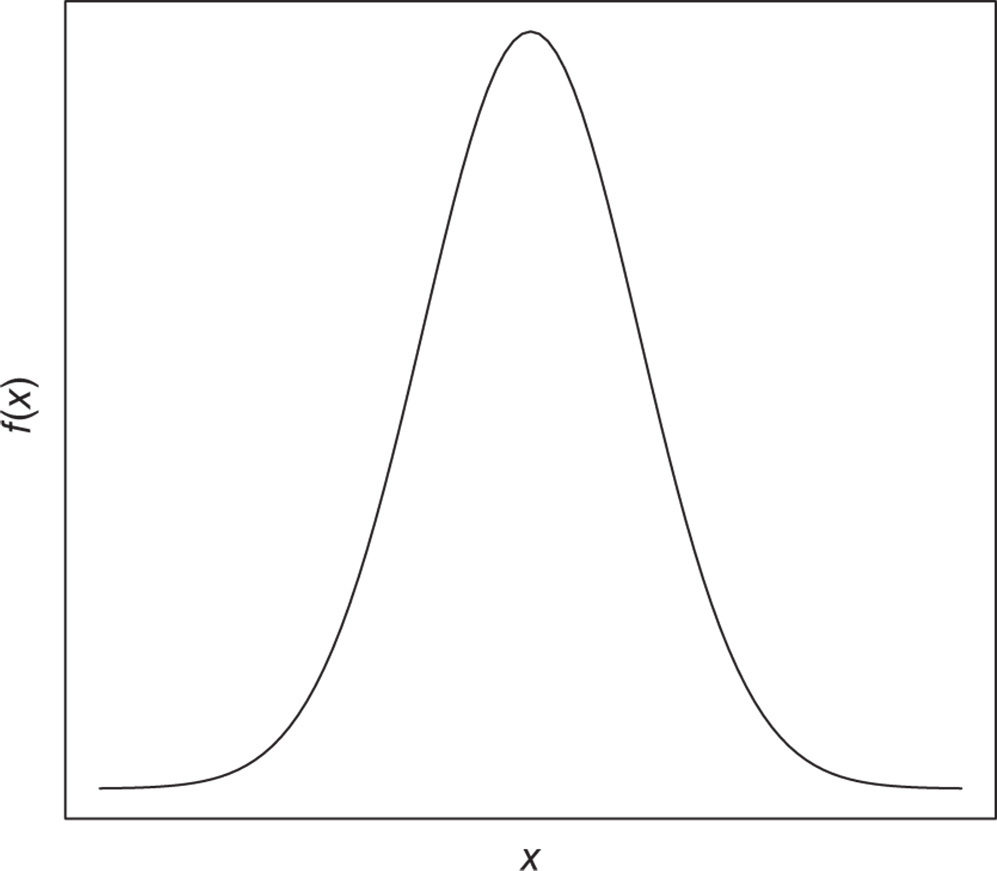
Figure 18.1 A Bell‐Shaped and Symmetrical Curve
This bell‐shaped curve, symmetrical about the central value, is called the “normal distribution.”
Let us consider the heights of females and males. It is easy to accept that, on average, males are taller than females, but maybe the spread about their respective averages could be the same. It is credible also that most female and male heights cluster around the average, getting fewer as the height increases above and decreases below the average. The heights of females and males might well be modeled by the normal distributions depicted in Fig. 18.2.
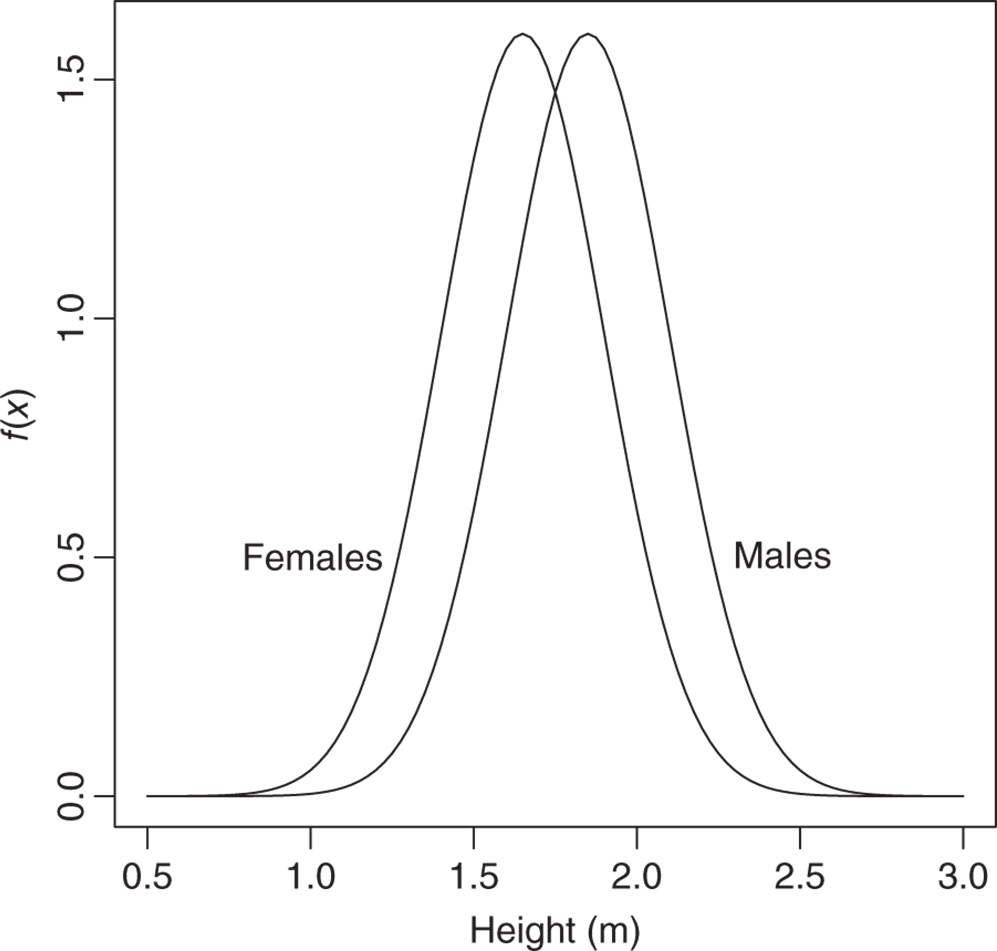
Figure 18.2 Two Normal Distributions with Different Means and the Same Spread
In Fig. 18.2, we see two bell‐shaped curves: the first one depicting the female heights is centered lower down the axis than the males, but the variation at either side of this central point is the same for both females and males.
Another example of normal distributions arises in product manufacturing. Suppose components are manufactured ...
Get Probability with R, 2nd Edition now with the O’Reilly learning platform.
O’Reilly members experience books, live events, courses curated by job role, and more from O’Reilly and nearly 200 top publishers.

