12.1. Adding a Gauge to an Existing Report
Now with SSRS 2008 you have the capability to add gauges to your reports, and your first step should be to see if you can enhance existing reports in your environment. Several reports that you currently use in your environment might benefit from visual enhancement, and with gauges you can give your reports the improvement they need.
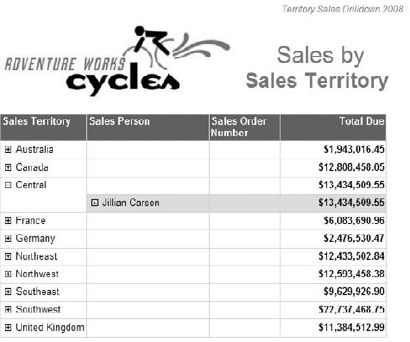
One of the examples of this situation can be easily demonstrated using the AdventureWorks Sales by Sales Territory report, as shown in Figure 12-1. The report shows the total numbers for each sales territory, but by looking at this there is no easy way to tell whether Adventure Works is doing well or not. The best way to measure performance of an organization or a business unit is to have Key Performance Indicators (KPIs). KPIs are the business metrics that help you measure the success of an organization or a business unit based on that organization or business unit's goals.
Figure 12-1. Figure 12-1

So to get a better understanding of where the sales organization is with its goals, you need KPIs. For this example's sake, assume that Adventure Works has a set a KPI for the Australia, Canada, and Central sales territories as follows:
| Sales Territory | Target | Bad | Good | Very Good |
|---|---|---|---|---|
| Australia | $3MM | $0MM to $1.5MM | $1.5MM to $2.5MM | $3.5MM to $5MM |
| Canada | $12MM | $0MM to $6MM | $6MM to $12MM | $12MM to $15MM |
| Central | $15MM | $0MM to $8MM | $8MM to ... |
Get Professional Microsoft® SharePoint® Server 2007 Reporting with SQL Server 2008 Reporting Services now with the O’Reilly learning platform.
O’Reilly members experience books, live events, courses curated by job role, and more from O’Reilly and nearly 200 top publishers.

